A gage run chart is a plot of all your observations by operator and part number. The gage run
chart is one of the most helpful charts you can use to assess differences in
measurements between different operators and different parts.
The plot lets you see obvious patterns in the data. For example, you might see that one operator consistently measures higher than the others or that the measurements on certain parts vary more when compared to other parts.
The run chart contains the following elements:
Plotted points
The individual measurement values. Different color/symbol combinations represent each operator.
Horizontal reference line (Mean)
The overall mean of the measurements or a value entered based on historical process knowledge.
Vertical lines
Dividers that separate the measurements by part.
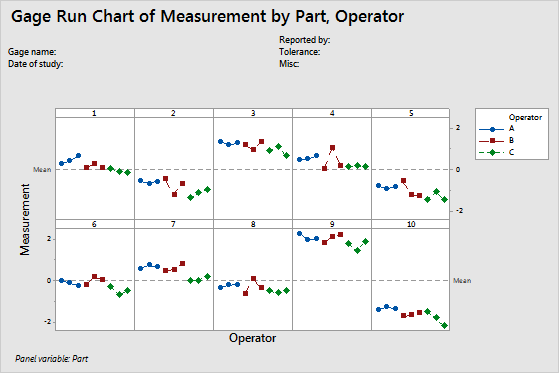
Example of a gage run chart
For example, you have three operators measuring 10 parts, three times each:
A horizontal reference line is drawn at the mean, which can be calculated from the data, or from a value you enter from prior knowledge of the process. In this chart, you can see differences in measurements between different operators and parts, such as:
While Operator A and C tend to measure their three replicates relatively consistently, Operator B is not consistent across trials on several parts.
Part 9 measurements are much higher than the mean, and Part 10 measurements are much lower than the mean.
On average, Operator C tends to measure slightly lower than the other operators.