In This Topic
Step 1: Assess the variation in measurements compared to the tolerance range
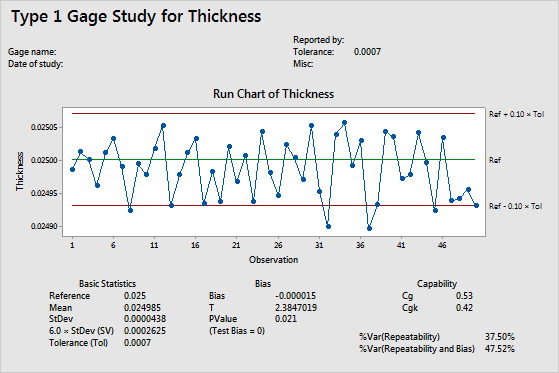
Use a run chart to look for evidence of bias or other measurement system variation in your process.
You might have measurements that are close to the reference line, measurements that vary throughout the entire tolerance range, or measurements that exceed the ± 10% tolerance range. If any of the points exceed the limits, you should question the system's capability.
Key Result: Run chart
In these results, most of the thickness measurements fall within the ± 10% tolerance range. However, some of the measurements are lower than expected (lower than the −10% tolerance range), which may indicate a problem with the measurement system.
Step 2: Assess the bias in the measurement system
The gage bias indicates the difference between the mean of the measurements and the reference value. Use the p-value to determine whether your measurement system has significant bias. The null hypothesis is that bias = 0 versus the alternate hypothesis that bias ≠ 0.
To determine whether the measurement system has significant bias, compare the p-value to the significance level (denoted as α or alpha). Usually, a significance level of 0.05 works well. A significance level of 0.05 indicates a 5% risk of concluding that a system has bias when it does not.
- P-value ≤ α: The measurement system has bias (Reject H0)
- If the p-value is less than or equal to the significance level, you reject the null hypothesis. You can conclude that your measurement system has statistically significant bias. Investigate your measurement system to determine the cause of this bias and improve your measurement system.
- P-value > α: Cannot conclude that the measurement system does not have bias (Fail to reject H0)
- If the p-value is greater than the significance level, you fail to reject the null hypothesis. You do not have enough evidence to conclude that the measurement system bias is statistically significant. However, you also cannot conclude that the measurement system does not have bias.
Key Results: Bias, T, P-value
In these results, because the p-value of 0.021 is less than the significance level of 0.05, there is sufficient evidence to conclude that bias exists. The amount of bias is statistically significant, although it seems small (-0.000015).
Step 3: Assess the capability of the measurement system
Use the capability indices to determine whether your measurement system is capable of measuring parts consistently and accurately.
Cg compares the tolerance with measurement variation. CgK compares the tolerance with measurement variation and bias.
Key Results: Cg, CgK
In these results, Cg is 0.53 and CgK is 0.42. Both of these capability indices are less than the commonly used benchmark value of 1.33. These results indicate that the measurement system cannot measure parts consistently and accurately. You must improve the measurement system to make it more reliable.