An engineer wants to certify an ultrasonic measurement system that is used to measure the thickness of a protective coating on painted doors. The engineer obtains a reference sample with a known coating thickness of 0.025 inches. An operator measures the reference panel 50 times.
The engineer wants to determine whether the measurement system can measure parts consistently and accurately when the tolerance range is 0.0007.
- Open the sample data, HardcoatThickness.MWX.
- Choose .
- In Measurement data, enter Thickness.
- In Reference, enter 0.025.
- In Tolerance, select Upper spec - lower spec, and enter 0.0007.
- Click OK.
Interpret the results
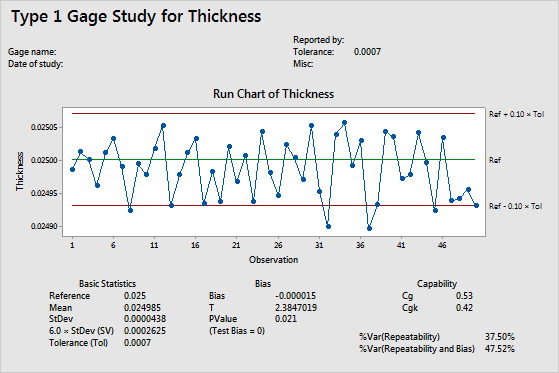
In the run chart, most of the thickness measurements fall within the ± 10% tolerance range. However, some of the measurements are lower than expected (lower than the reference - 10% tolerance limit). The lower measurements may indicate a problem with the measurement system.
The mean value of the thickness measurements is 0.024985, which is slightly lower than the reference value of 0.025. The standard deviation is 0.0000438, which is very small. However, because the tolerance range of 0.0007 is also very small, not much variation is allowed in the measurements.
- P-value for bias = 0.021. Because the p-value is less than a significance level of 0.05, the null hypothesis for the test of bias=0 must be rejected. The engineer can conclude that there is statistically significant bias present in the measurement system.
- Cg = 0.53 and Cgk = 0.42. Both capability indices are less than the commonly used benchmark value of 1.33, so the engineer concludes that the measurement system is not capable and needs improvement.
- %Var (Repeatability) = 37.50% and %Var (Repeatability and Bias) = 47.52%. These values are much larger than 15% (a commonly used benchmark), and indicate that the variation due to the measurement system is large.

