The Analysis Of Main Effects (ANOME) chart has a
reference line at the overall average and plots the averages of the measurements by each
operator. The chart includes decision limits that test for operator bias. The decision
limits use the following formulas:
Upper Decision Limit (UDL)
+ ×
Lower Decision Limit (LDL)
− ×
In the equations, is the ANOME alpha scale factor. This factor has the following
equation:
Notation
Term
Description
the overall mean of the measurements
the average range
The positive, two-sided critical value from the t distribution for /2. By default, = 0.05.
The unbiasing constant from Appendix C 1. When looking for this
value, use g = (# of parts) * (# of operators) and m = (# of
replicates).
n
the number of measurements by one operator
1 Automotive Industry Action
Group (AIAG) (2010). Measurement Systems Analysis Reference
Manual, 4th edition. Chrysler, Ford, General Motors
Supplier Quality Requirements Task Force
 +
+  ×
× 
 −
−  ×
× 
 is the ANOME alpha scale factor. This factor has the following
equation:
is the ANOME alpha scale factor. This factor has the following
equation: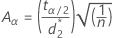


 /2. By default,
  = 0.05.