An engineer selects 10 parts that represent the expected range of the process variation. Three operators measure the 10 parts, three times per part, in a random order.
The engineer performs a crossed EMP study to assess the variability in measurements that may be from the measurement system.
- Open the sample data, GageData.MWX.
- Choose .
- In Parts, enter Part.
- In Operators, enter Operator.
- In Measurements, enter Measurement.
- Under Method of Analysis, select ANOVA.
- Click OK in each dialog box.
Interpret the results
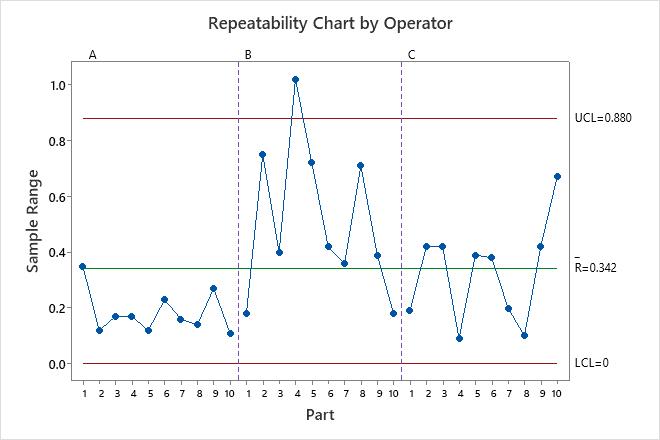
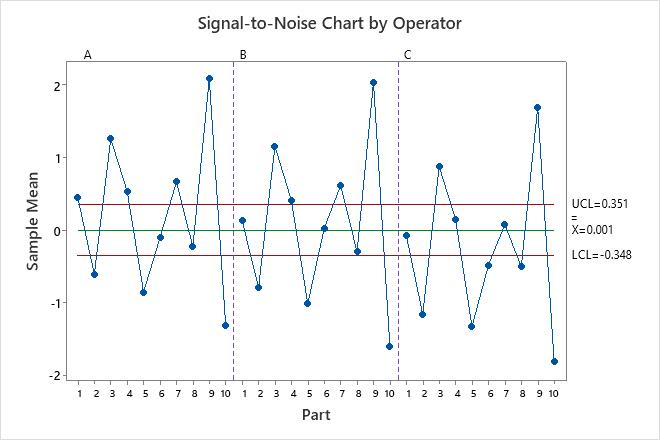
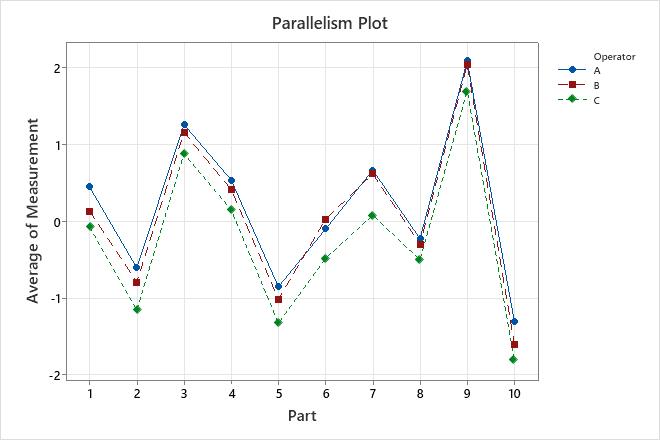
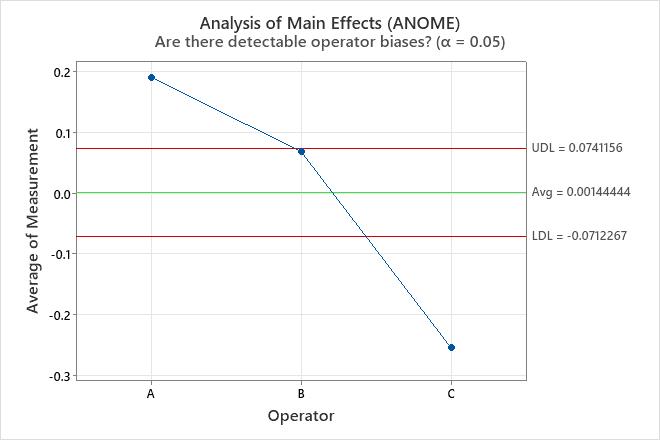
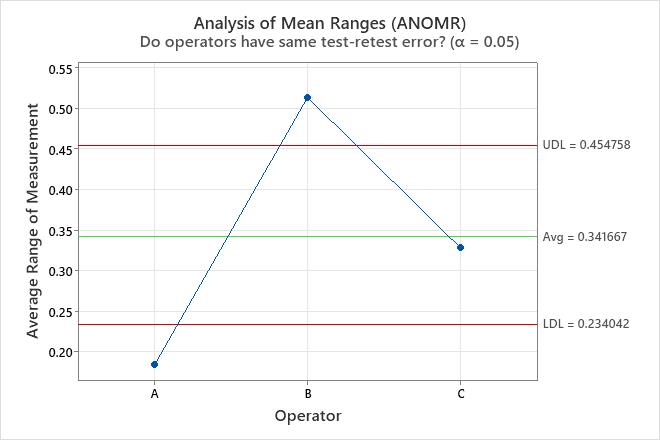
The variance components table and the plots show opportunities to improve the measurement system. For example, the repeatability chart has a point outside of the control limits. Investigate this point to identify potential measurement problems. The points outside of the decision limits on the Analysis of Main Effects plot and the Analysis of Mean Ranges plot show that the operators measure the parts differently. Investigate how the operators measure the parts to improve the measurement system. The parallelism plot provides insight into the differences among the operators. In these data, the parallelism plot shows that Operator C has the least average measurement for every part.
The Classification Guidelines table gives the probabilities of warning for an X-bar chart to have an out-of-control point within ten subgroups for test 1 or for tests 1, 5, 6 and 8. First-class and second-class measurement systems are usually sufficient for process improvement activities with an X-bar chart that uses test 1. Third-class measurement systems are usually sufficient for process improvement activities with an X-bar chart that uses rules 1, 5, 6, and 8. In these data, the EMP statistics show that the measurement system is first class. Even though the measurement system shows opportunities for improvement, the system is sufficient for many process improvement activities.
The Effective Resolution of Measurements table compares precision of the measurements to the probable error from the measurement system. In these data, the measurements contain a hundredths place, but the probably error is over one tenth. The results recommend that the measurements go to the tenths place instead of the hundredths place. The engineer plans to round the measurements, then look at the new EMP statistics to verify that the conclusions are the same.
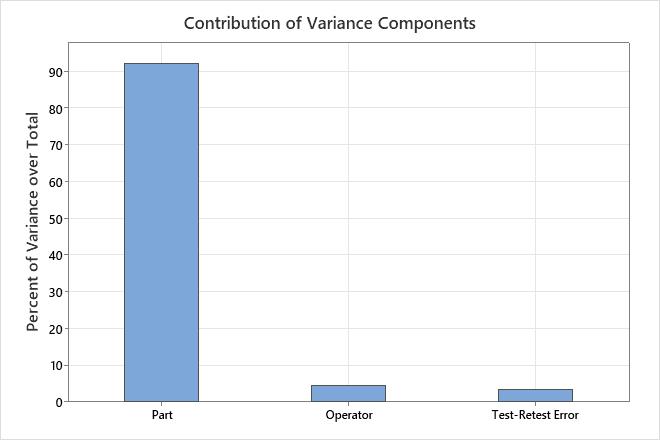
Variance Components
| Source | Variance | %Total | StdDev |
|---|---|---|---|
| Test-Retest Error (Repeatability) | 0.03997 | 3.394 | 0.19993 |
| Operator (Reproducibility) | 0.05146 | 4.368 | 0.22684 |
| Part (Product variation) | 1.08645 | 92.238 | 1.04233 |
| Total | 1.17788 | 100.000 | 1.08530 |
EMP Statistics
| Statistic | Value | Classification |
|---|---|---|
| Test-Retest Error | 0.1999 | |
| Degrees of Freedom | 78.0000 | |
| Probable Error | 0.1349 | |
| Intraclass Correlation (no bias) | 0.9645 | First Class |
| Intraclass Correlation (with bias) | 0.9224 | First Class |
| Bias Impact | 0.0421 |
Classification Guidelines
| Classification | Intraclass Correlation | Attenuation of Process Signals | Probability of Warning, Test 1* | Probability of Warning, Tests* |
|---|---|---|---|---|
| First Class | 0.80 - 1.00 | Less than 11% | 0.99 - 1.00 | 1.00 |
| Second Class | 0.50 - 0.80 | 11 - 29% | 0.88 - 0.99 | 1.00 |
| Third Class | 0.20 - 0.50 | 29 - 55% | 0.40 - 0.88 | 0.92 - 1.00 |
| Fourth Class | 0.00 - 0.20 | More than 55% | 0.03 - 0.40 | 0.08 - 0.92 |
Effective Resolution of Measurements
| Source | Value |
|---|---|
| Probable Error (PE) | 0.134853 |
| Lower Bound of Increment (0.1 * PE) | 0.013485 |
| Smallest Effective Increment (0.22 * PE) | 0.029668 |
| Current Measurement Increment | 0.010000 |
| Largest Effective Increment (2.2 * PE) | 0.296676 |