In This Topic
Step 1: Evaluate the appraiser agreement visually
To determine the consistency of each appraiser's ratings, evaluate the Within Appraisers graph. Compare the percentage matched (blue circle) with the confidence interval for the percentage matched (red line) for each appraiser.
To determine the correctness of each appraiser's ratings, evaluate the Appraiser vs Standard graph. Compare the percentage matched (blue circle) with the confidence interval for the percentage matched (red line) for each appraiser.
Note
Minitab displays the Within Appraisers graph only when you have multiple trials.
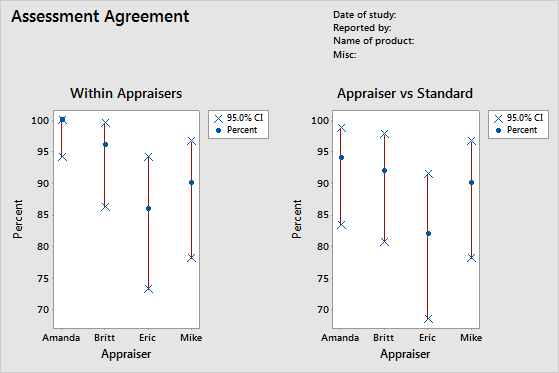
This Within Appraisers graph indicates that Amanda has the most consistent ratings and Eric has the least consistent ratings. The Appraiser vs Standard graph indicates that Amanda has the most correct ratings and Eric has the least correct ratings.
Step 2: Assess the consistency of responses for each appraiser
To determine the consistency of each appraiser's ratings, evaluate the kappa statistics in the Within Appraisers table. When the ratings are ordinal, you should also evaluate the Kendall's coefficients of concordance. Minitab displays the Within Appraiser table when each appraiser rates an item more than once.
Use kappa statistics to assess the degree of agreement of the nominal or ordinal ratings made by multiple appraisers when the appraisers evaluate the same samples.
- When Kappa = 1, perfect agreement exists.
- When Kappa = 0, agreement is the same as would be expected by chance.
- When Kappa < 0, agreement is weaker than expected by chance; this rarely occurs.
The AIAG suggests that a kappa value of at least 0.75 indicates good agreement. However, larger kappa values, such as 0.90, are preferred.
When you have ordinal ratings, such as defect severity ratings on a scale of 1–5, Kendall's coefficients, which account for ordering, are usually more appropriate statistics to determine association than kappa alone.
Note
Remember that the Within Appraisers table indicates whether the appraisers' ratings are consistent, but not whether the ratings agree with the reference values. Consistent ratings aren't necessarily correct ratings.
Assessment Agreement
| Appraiser | # Inspected | # Matched | Percent | 95% CI |
|---|---|---|---|---|
| Amanda | 50 | 50 | 100.00 | (94.18, 100.00) |
| Britt | 50 | 48 | 96.00 | (86.29, 99.51) |
| Eric | 50 | 43 | 86.00 | (73.26, 94.18) |
| Mike | 50 | 45 | 90.00 | (78.19, 96.67) |
Fleiss’ Kappa Statistics
| Appraiser | Response | Kappa | SE Kappa | Z | P(vs > 0) |
|---|---|---|---|---|---|
| Amanda | 1 | 1.00000 | 0.141421 | 7.0711 | 0.0000 |
| 2 | 1.00000 | 0.141421 | 7.0711 | 0.0000 | |
| 3 | 1.00000 | 0.141421 | 7.0711 | 0.0000 | |
| 4 | 1.00000 | 0.141421 | 7.0711 | 0.0000 | |
| 5 | 1.00000 | 0.141421 | 7.0711 | 0.0000 | |
| Overall | 1.00000 | 0.071052 | 14.0741 | 0.0000 | |
| Britt | 1 | 1.00000 | 0.141421 | 7.0711 | 0.0000 |
| 2 | 0.89605 | 0.141421 | 6.3360 | 0.0000 | |
| 3 | 0.86450 | 0.141421 | 6.1129 | 0.0000 | |
| 4 | 1.00000 | 0.141421 | 7.0711 | 0.0000 | |
| 5 | 1.00000 | 0.141421 | 7.0711 | 0.0000 | |
| Overall | 0.94965 | 0.071401 | 13.3002 | 0.0000 | |
| Eric | 1 | 0.83060 | 0.141421 | 5.8733 | 0.0000 |
| 2 | 0.84000 | 0.141421 | 5.9397 | 0.0000 | |
| 3 | 0.70238 | 0.141421 | 4.9666 | 0.0000 | |
| 4 | 0.70238 | 0.141421 | 4.9666 | 0.0000 | |
| 5 | 1.00000 | 0.141421 | 7.0711 | 0.0000 | |
| Overall | 0.82354 | 0.071591 | 11.5034 | 0.0000 | |
| Mike | 1 | 1.00000 | 0.141421 | 7.0711 | 0.0000 |
| 2 | 0.83060 | 0.141421 | 5.8733 | 0.0000 | |
| 3 | 0.81917 | 0.141421 | 5.7924 | 0.0000 | |
| 4 | 0.86450 | 0.141421 | 6.1129 | 0.0000 | |
| 5 | 0.86450 | 0.141421 | 6.1129 | 0.0000 | |
| Overall | 0.87472 | 0.070945 | 12.3295 | 0.0000 |
Kendall’s Coefficient of Concordance
| Appraiser | Coef | Chi - Sq | DF | P |
|---|---|---|---|---|
| Amanda | 1.00000 | 98.0000 | 49 | 0.0000 |
| Britt | 0.99448 | 97.4587 | 49 | 0.0000 |
| Eric | 0.98446 | 96.4769 | 49 | 0.0001 |
| Mike | 0.98700 | 96.7256 | 49 | 0.0001 |
Key Results: Kappa, Kendall's coefficient of concordance
Many of the kappa values are 1, which indicates perfect agreement within an appraiser between trials. Some of Eric's kappa values are close to 0.70. You might want to investigate why Eric's ratings of those samples were inconsistent. Because the data are ordinal, Minitab provides the Kendall's coefficient of concordance values. These values are all greater than 0.98, which indicates a very strong association within the appraiser ratings.
Step 3: Assess the correctness of responses for each appraiser
To determine the correctness of each appraiser's ratings, evaluate the kappa statistics in the Each Appraiser vs Standard table. When the ratings are ordinal, you should also evaluate the Kendall's correlation coefficients. Minitab displays the Each Appraiser vs Standard table when you specify a reference value for each sample.
Use kappa statistics to assess the degree of agreement of the nominal or ordinal ratings made by multiple appraisers when the appraisers evaluate the same samples.
- When Kappa = 1, perfect agreement exists.
- When Kappa = 0, agreement is the same as would be expected by chance.
- When Kappa < 0, agreement is weaker than expected by chance; this rarely occurs.
The AIAG suggests that a kappa value of at least 0.75 indicates good agreement. However, larger kappa values, such as 0.90, are preferred.
When you have ordinal ratings, such as defect severity ratings on a scale of 1–5, Kendall's coefficients, which account for ordering, are usually more appropriate statistics to determine association than kappa alone.
Assessment Agreement
| Appraiser | # Inspected | # Matched | Percent | 95% CI |
|---|---|---|---|---|
| Amanda | 50 | 47 | 94.00 | (83.45, 98.75) |
| Britt | 50 | 46 | 92.00 | (80.77, 97.78) |
| Eric | 50 | 41 | 82.00 | (68.56, 91.42) |
| Mike | 50 | 45 | 90.00 | (78.19, 96.67) |
Fleiss’ Kappa Statistics
| Appraiser | Response | Kappa | SE Kappa | Z | P(vs > 0) |
|---|---|---|---|---|---|
| Amanda | 1 | 1.00000 | 0.100000 | 10.0000 | 0.0000 |
| 2 | 0.83060 | 0.100000 | 8.3060 | 0.0000 | |
| 3 | 0.81917 | 0.100000 | 8.1917 | 0.0000 | |
| 4 | 1.00000 | 0.100000 | 10.0000 | 0.0000 | |
| 5 | 1.00000 | 0.100000 | 10.0000 | 0.0000 | |
| Overall | 0.92476 | 0.050257 | 18.4006 | 0.0000 | |
| Britt | 1 | 1.00000 | 0.100000 | 10.0000 | 0.0000 |
| 2 | 0.83838 | 0.100000 | 8.3838 | 0.0000 | |
| 3 | 0.80725 | 0.100000 | 8.0725 | 0.0000 | |
| 4 | 1.00000 | 0.100000 | 10.0000 | 0.0000 | |
| 5 | 1.00000 | 0.100000 | 10.0000 | 0.0000 | |
| Overall | 0.92462 | 0.050396 | 18.3473 | 0.0000 | |
| Eric | 1 | 0.91159 | 0.100000 | 9.1159 | 0.0000 |
| 2 | 0.81035 | 0.100000 | 8.1035 | 0.0000 | |
| 3 | 0.72619 | 0.100000 | 7.2619 | 0.0000 | |
| 4 | 0.84919 | 0.100000 | 8.4919 | 0.0000 | |
| 5 | 1.00000 | 0.100000 | 10.0000 | 0.0000 | |
| Overall | 0.86163 | 0.050500 | 17.0622 | 0.0000 | |
| Mike | 1 | 1.00000 | 0.100000 | 10.0000 | 0.0000 |
| 2 | 0.91694 | 0.100000 | 9.1694 | 0.0000 | |
| 3 | 0.90736 | 0.100000 | 9.0736 | 0.0000 | |
| 4 | 0.92913 | 0.100000 | 9.2913 | 0.0000 | |
| 5 | 0.93502 | 0.100000 | 9.3502 | 0.0000 | |
| Overall | 0.93732 | 0.050211 | 18.6674 | 0.0000 |
Kendall’s Correlation Coefficient
| Appraiser | Coef | SE Coef | Z | P |
|---|---|---|---|---|
| Amanda | 0.967386 | 0.0690066 | 14.0128 | 0.0000 |
| Britt | 0.967835 | 0.0690066 | 14.0193 | 0.0000 |
| Eric | 0.951863 | 0.0690066 | 13.7879 | 0.0000 |
| Mike | 0.975168 | 0.0690066 | 14.1256 | 0.0000 |
Key Results: Kappa, Kendall's correlation coefficient
Most of the kappa values are larger than 0.80, which indicates good agreement between each appraiser and the standard. A few of the kappa values are close to 0.70, which indicates that you may need to investigate certain samples or certain appraisers further. Because the data are ordinal, Minitab provides the Kendall's correlation coefficients. These values range from 0.951863 and 0.975168, which indicate a strong association between the ratings and the standard values.
Step 4: Assess the consistency of responses between appraisers
To determine the consistency between the appraiser's ratings, evaluate the kappa statistics in the Between Appraisers table. When the ratings are ordinal, you should also evaluate the Kendall's coefficient of concordance.
Use kappa statistics to assess the degree of agreement of the nominal or ordinal ratings made by multiple appraisers when the appraisers evaluate the same samples.
- When Kappa = 1, perfect agreement exists.
- When Kappa = 0, agreement is the same as would be expected by chance.
- When Kappa < 0, agreement is weaker than expected by chance; this rarely occurs.
The AIAG suggests that a kappa value of at least 0.75 indicates good agreement. However, larger kappa values, such as 0.90, are preferred.
When you have ordinal ratings, such as defect severity ratings on a scale of 1–5, Kendall's coefficients, which account for ordering, are usually more appropriate statistics to determine association than kappa alone.
Note
Remember that the Between Appraisers table indicates whether the appraisers' ratings are consistent, but not whether the ratings agree with the reference values. Consistent ratings aren't necessarily correct ratings.
Assessment Agreement
| # Inspected | # Matched | Percent | 95% CI |
|---|---|---|---|
| 50 | 37 | 74.00 | (59.66, 85.37) |
Fleiss’ Kappa Statistics
| Response | Kappa | SE Kappa | Z | P(vs > 0) |
|---|---|---|---|---|
| 1 | 0.954392 | 0.0267261 | 35.7101 | 0.0000 |
| 2 | 0.827694 | 0.0267261 | 30.9695 | 0.0000 |
| 3 | 0.772541 | 0.0267261 | 28.9058 | 0.0000 |
| 4 | 0.891127 | 0.0267261 | 33.3429 | 0.0000 |
| 5 | 0.968148 | 0.0267261 | 36.2248 | 0.0000 |
| Overall | 0.881705 | 0.0134362 | 65.6218 | 0.0000 |
Kendall’s Coefficient of Concordance
| Coef | Chi - Sq | DF | P |
|---|---|---|---|
| 0.976681 | 382.859 | 49 | 0.0000 |
Key Results: Kappa, Kendall's coefficient of concordance
All the kappa values are larger than 0.77, which indicates minimally acceptable agreement between appraisers. The appraisers have the most agreement for samples 1 and 5, and the least agreement for sample 3. Because the data are ordinal, Minitab provides the Kendall's coefficient of concordance (0.976681), which indicates a very strong association between the appraiser ratings.
Step 5: Assess the correctness of responses for all appraisers
To determine the correctness of all the appraiser's ratings, evaluate the kappa statistics in the All Appraisers vs Standard table. When the ratings are ordinal, you should also evaluate the Kendall's coefficients of concordance.
Use kappa statistics to assess the degree of agreement of the nominal or ordinal ratings made by multiple appraisers when the appraisers evaluate the same samples.
- When Kappa = 1, perfect agreement exists.
- When Kappa = 0, agreement is the same as would be expected by chance.
- When Kappa < 0, agreement is weaker than expected by chance; this rarely occurs.
The AIAG suggests that a kappa value of at least 0.75 indicates good agreement. However, larger kappa values, such as 0.90, are preferred.
When you have ordinal ratings, such as defect severity ratings on a scale of 1–5, Kendall's coefficients, which account for ordering, are usually more appropriate statistics to determine association than kappa alone.
Assessment Agreement
| # Inspected | # Matched | Percent | 95% CI |
|---|---|---|---|
| 50 | 37 | 74.00 | (59.66, 85.37) |
Fleiss’ Kappa Statistics
| Response | Kappa | SE Kappa | Z | P(vs > 0) |
|---|---|---|---|---|
| 1 | 0.977897 | 0.0500000 | 19.5579 | 0.0000 |
| 2 | 0.849068 | 0.0500000 | 16.9814 | 0.0000 |
| 3 | 0.814992 | 0.0500000 | 16.2998 | 0.0000 |
| 4 | 0.944580 | 0.0500000 | 18.8916 | 0.0000 |
| 5 | 0.983756 | 0.0500000 | 19.6751 | 0.0000 |
| Overall | 0.912082 | 0.0251705 | 36.2362 | 0.0000 |
Kendall’s Correlation Coefficient
| Coef | SE Coef | Z | P |
|---|---|---|---|
| 0.965563 | 0.0345033 | 27.9817 | 0.0000 |
Key Results: Kappa, Kendall's coefficient of concordance
These results show that all the appraisers correctly matched the standard ratings on 37 of the 50 samples. The overall kappa value is 0.912082, which indicates strong agreement with the standard values. Because the data are ordinal, Minitab provides the Kendall's coefficient of concordance (0.965563), which indicates a strong association between the ratings and the standard values.