Stamp and Index are options that add labels to the tick marks on the x-axis of a control chart.
- Stamp adds labels that show the values, such as dates and times, from one or more columns that you specify.
- Index adds labels that show the order of the data in the worksheet.
To change these options for your control chart, click Scale in the main dialog box.
Consider the following example. A quality team uses a control chart to track variation in the weight of a precision machine part. If they index the x-axis scale, their observations are numbered sequentially. However, they choose to stamp the x-axis scale with dates from a column in the worksheet. The dates on the chart are in the same format as in the worksheet, for example, 3/06/2006.
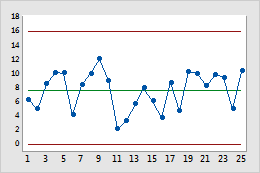
Example of an indexed x-axis scale
When the x-axis scale is indexed, 1 indicates the first observation in the worksheet column, 2 indicates the second observation, and so on.
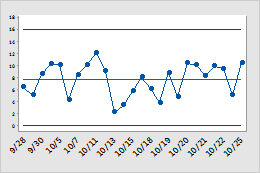
Example of a stamped x-axis scale
When the x-axis scale is stamped, the labels for the tick marks identify the values from one or more columns from the worksheet.