In This Topic
Step 1: Determine whether the process mean is stable
The zone chart plots the cumulative scores based on zones at 1, 2, and 3 standard deviations from the center line. The center line is the overall average of the individual observations or subgroup averages. Each plotted point is assigned a weight based on how far that point is from the center line.
- Zone 1 is between the center line and 1σ and has a weight of 0
- Zone 2 is between 1σ and 2σ and has a weight of 2
- Zone 3 is between 2σ and 3σ and has a weight of 4
- Zone 4 is beyond 3σ and has a weight of 8
The cumulative score is a sum of the weights of the plotted points. Each time the points cross the center line, the cumulative score is reset to zero. Each cumulative score helps to determine whether the process is in control. When the cumulative score is greater than or equal to 8, the process is out of control.
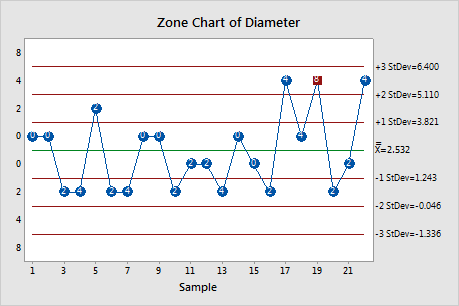
In these results, subgroup 19 has a cumulative score of 8. Investigate this subgroup.
Step 2: Identify which points failed each test
Each time the points cross the center line on a zone chart, the cumulative score is set to zero. Each cumulative score helps determine whether or not the process is in control. When the cumulative score is greater than or equal to 8, the process has a nonrandom pattern in the data that may be a result of special-cause variation. Out-of-control points are reported in the output.
Test Results for Zone Chart of Diameter
| TEST. Cumulative score greater than or equal to zone 4 score. |
|---|
| Test Failed at points: 19 |
In these results, subgroup 19 is out of control. Investigate this subgroup to find out why this point is above zone 4.