A quality engineer at an automotive parts plant monitors the lengths of camshafts. Three machines manufacture camshafts for three shifts each day. The engineer measures five camshafts from each machine during each shift.
The quality engineer creates an Xbar-R chart for each machine to monitor the camshaft lengths.
- Open the sample data, CamshaftLength.MWX.
- Choose .
- From the drop-down list, select All observations for a chart are in one column and enter Machine 1 Machine 2 Machine 3.
- In Subgroup sizes, enter Subgroup ID.
- Click Xbar-R Options.
- On the Tests tab, select 1 point > K standard deviations from center line (Test 1), K points in a row on same side of center line (Test 2), and K points in a row within 1 standard deviation of center line (either side) (Test 7).If you are not sure which tests apply in your specific situation, use Tests 1, 2, and 7 when you first establish the control limits based on your data. After the control limits are established, you can use the known values of those limits and Test 7 is no longer needed.
- Click OK in each dialog box.
Interpret the results
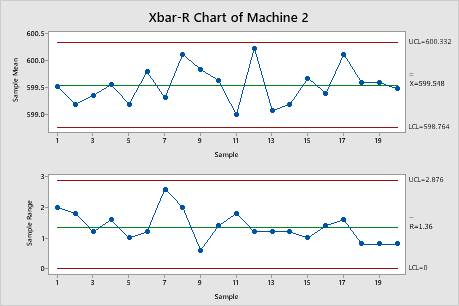
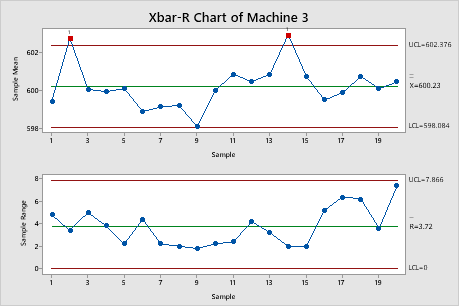
Minitab creates three Xbar-R charts, one chart for each machine. The engineer looks at the R chart first because, if the R chart shows that the process variation is not in control, then the control limits on the Xbar chart are inaccurate.
The R charts for all three machines show that the process variation is in control. No points are out of control, and all the points fall within the control limits in a random pattern.
The Xbar charts show that Machine 2 is in control, but Machines 1 and 3 are not. On the Xbar chart for Machine 2, no points are out of control. But Machine 1 has one out-of-control point, and Machine 3 has two out-of-control points.
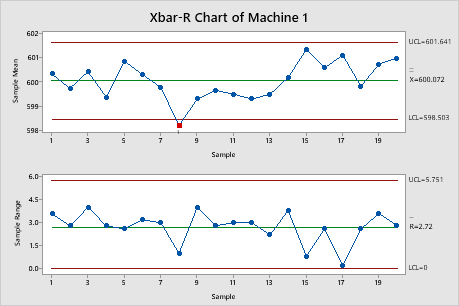
Test Results for Xbar Chart of Machine 1
| TEST 1. One point more than 3.00 standard deviations from center line. |
|---|
| Test Failed at points: 8 |
Test Results for Xbar Chart of Machine 3
| TEST 1. One point more than 3.00 standard deviations from center line. |
|---|
| Test Failed at points: 2, 14 |