In This Topic
Step 1: Identify small shifts in your process
The multivariate EWMA simultaneously monitors two or more related process characteristics in an exponentially weighted control chart. The chart consists of plotted points and an upper control limit. On the chart, each MEWMA point incorporates information from all the previous subgroups or observations in combination with a weighting factor that you specify.
Red points indicate subgroups that are above the upper control limit and not in control. One disadvantage to multivariate charts is that the scale is unrelated to the scale of any of the variables, and out-of-control signals do not reveal which variable (or combination of variables) caused the signal.
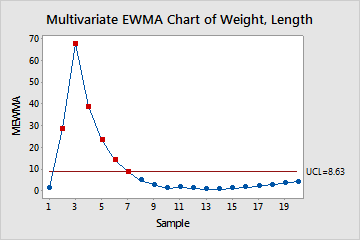
In these results, two points are above the upper control limit, which indicates that small shifts are present in this process. When you hold the pointer over a red point, you can get more information about this subgroup. The Multivariate EWMA chart shows a sharp increase in values from subgroups 2 to 3 and then a decrease from subgroup 4 to 9.
Step 2: Identify which points failed the test
Investigate any subgroups that are above the upper control limit. The output shows which points are above the upper control limit.
Test Results for MEWMA Chart of Weight, Length
| TEST. One point beyond control limits. |
|---|
| Test Failed at points: 2, 3, 4, 5, 6, 7 |