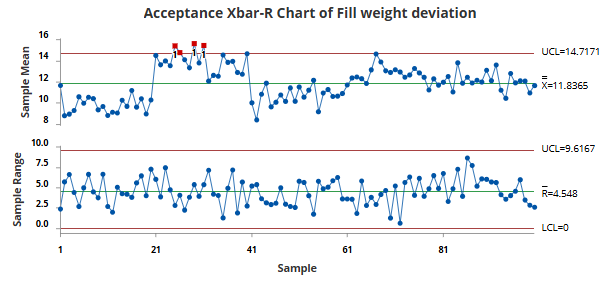
A quality engineer monitors deviations from the target fill weight for a packaged product. The deviations are measured in tenths of an ounce. The upper specification limit is 21.3 tenths of an ounce above the target. The process is allowed to shift as long as no more than 1% of the output is expected to exceed the upper specification limit. The engineer collects subgroups of 5 packages at regular intervals and creates an Acceptance Xbar-R Chart.
- Open the sample data, FillWeights.MWX.
- Choose .
- From the drop-down list, select All observations for a chart are in one column and enter Fill weight deviation.
- In Subgroup sizes, enter 5.
- In Upper spec, enter 21.3.
- In Accepted percentage outside of each spec limit, enter 1.
- Select OK.
Interpret the results
The R chart does not show evidence of unusual variation, so the engineer can interpret the Acceptance Xbar chart. Three subgroup means are above the upper acceptance control limit. These points indicate that the process mean shifted far enough toward the upper specification limit that more than 1% of the process output might exceed the specification limit.
After sample 40, the process mean shifts downward, and the subgroup means remain within the upper acceptance control limit. The engineer should investigate the three out-of-control subgroups to determine whether the shift reflects an additional cause or a stronger effect from an existing cause. Possible causes include a machine adjustment, a change in raw material, an operator change, or a different production lot.