In This Topic
Step 1: Examine the Acceptance Xbar chart to determine whether shifts in the process mean are acceptable
The Acceptance Xbar chart plots the average of the measurements within each subgroup. The center line is the average of all subgroup averages. The acceptance control limits are based on the specification limits, the accepted percentage outside each specification limit, the probability of intervention, the subgroup size, and the estimated process variation. The chart displays a lower acceptance control limit, an upper acceptance control limit, or both, depending on which specification limits you enter.
Red points indicate subgroup means that are outside an acceptance control limit. A point outside an acceptance control limit indicates that the process mean shifted far enough toward the corresponding specification limit that the accepted percentage of process output outside the specification limit might be exceeded.
Shifts in the process mean that remain within the acceptance control limits do not indicate that the accepted percentage is exceeded. If the chart shows an out-of-control point, investigate whether the shift reflects an additional cause or a stronger effect from an existing cause.
Out-of-control points can influence the estimates of process parameters and prevent control limits from truly representing your process. If out-of-control points are due to special causes, then consider omitting these points from the calculations. For more information, go to Specify how to estimate the parameters for Acceptance Xbar Chart.
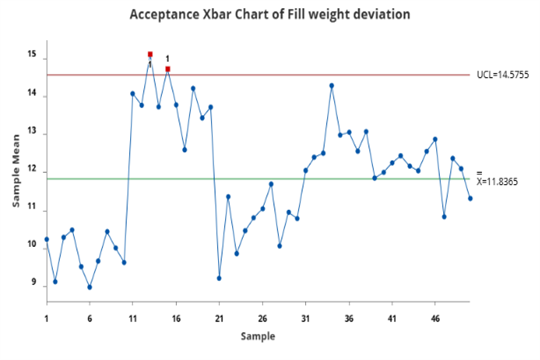
Two subgroup means during the first upward shift are above the upper acceptance control limit. These points indicate that the process mean shifted far enough toward the upper specification limit that more than 1% of the process output might exceed the specification limit.
The other shifts in the process mean are within the acceptance control limit and do not indicate that the accepted percentage is exceeded. The engineer should investigate the two out-of-control subgroups to determine whether the shift reflects an additional cause or a stronger effect from an existing cause. Possible causes include a machine adjustment, a change in raw material, an operator change, or a different production lot.
Step 2: Identify which points failed the test
Investigate any subgroup means that fail Test 1. On the Acceptance Xbar chart, Test 1 identifies subgroup means that are outside the acceptance control limits. The test results in the output identify all the points that failed the test.
Test Results for Xbar Chart of Fill weight deviation
| TEST 1. One point outside of acceptance control limits. |
|---|
| Test Failed at points: 13, 15 |
