In This Topic
Plotted points
Center line
The center line represents the process mean, μ. If you do not specify a historical value for the process mean, Minitab uses the mean of the observations.
Control limits
Upper control limit (UCL)
Minitab calculates a control limit for each specification limit that you enter. If you use a Box-Cox transformation, Minitab transforms the specification limits for these calculations.
The upper control limit is calculated as follows:

Lower control limit (LCL)
The lower control limit is calculated as follows:


Notation
| Term | Description |
|---|---|
| U | upper specification limit |
| L | lower specification limit |
| σ̂ | estimator for within-subgroup variation |
| n | moving range length |
| p | accepted proportion outside a specification limit |
| PA | probability of intervention when the proportion outside a specification limit exceeds the accepted proportion |
| u | quantile of the standard normal distribution |
Average moving range method
The average moving range,  , of length w is given by the following formula:
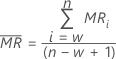
where MRi is the moving range for observation i, calculated as follows:

Minitab uses  to calculate Smr, which is an unbiased estimate of σ:

Notation
| Term | Description |
|---|---|
| n | number of observations |
| w | length of the moving range. The default is 2. |
| d2() | value of unbiasing constant d2 that corresponds to the value specified in parentheses. |
Nelson estimate
Use the Nelson estimate to correct for unusually large moving range values in the calculation of the control limits. The procedure is similar to the procedure proposed by Nelson1 Minitab eliminates any moving range values that are more than 3σ larger than the average moving range, then recalculates the average moving range and control limits.
Median moving range method
The median moving range,  , of length w is given by the following formula:

where w is the number of observations used in the moving range and MRi is the moving range for observation i, calculated as follows:

Minitab uses  to calculate Smr, which is an unbiased estimate of σ:

Notation
| Term | Description |
|---|---|
| n | number of observations |
| w | length of the moving range. The default is 2. |
| d4() | value of unbiasing constant d4 that corresponds to the value specified in parentheses. |
Square root of MSSD method
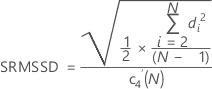
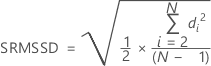
MSSD stands for the mean of squared successive differences. The square root of the MSSD (SRMSSD) is calculated as follows:
With unbiasing constant
Without unbiasing constant
Notation
| Term | Description |
|---|---|
| di | difference between the value of observation i and the value of observation i – 1 |
| N | number of observations |
| c4'(N) | unbiasing constant from a table |
Unbiasing constants d2(), d3(), and d4()
d2(N) is the expected value of the range of N observations from a normal population with standard deviation = 1. Thus, if r is the range of a sample of N observations from a normal distribution with standard deviation = σ, then E(r) = d2(N)σ.
d3(N) is the standard deviation of the range of N observations from a normal population with σ = 1. Thus, if r is the range of a sample of N observations from a normal distribution with standard deviation = σ, then stdev(r) = d3(N)σ.
Use the following table to find an unbiasing constant for a given value, N. (To determine the value of N, consult the formula for the statistic of interest.)



- D. J. Wheeler and D. S. Chambers. (1992). Understanding Statistical Process Control, Second Edition, SPC Press, Inc.
- H. Leon Harter (1960). "Tables of Range and Studentized Range". The Annals of Mathematical Statistics, Vol. 31, No. 4, Institute of Mathematical Statistics, 1122−1147.
| N | d2(N) | d3(N) | d4(N) |
|---|---|---|---|
| 2 | 1.128 | 0.8525 | 0.954 |
| 3 | 1.693 | 0.8884 | 1.588 |
| 4 | 2.059 | 0.8798 | 1.978 |
| 5 | 2.326 | 0.8641 | 2.257 |
| 6 | 2.534 | 0.8480 | 2.472 |
| 7 | 2.704 | 0.8332 | 2.645 |
| 8 | 2.847 | 0.8198 | 2.791 |
| 9 | 2.970 | 0.8078 | 2.915 |
| 10 | 3.078 | 0.7971 | 3.024 |
| 11 | 3.173 | 0.7873 | 3.121 |
| 12 | 3.258 | 0.7785 | 3.207 |
| 13 | 3.336 | 0.7704 | 3.285 |
| 14 | 3.407 | 0.7630 | 3.356 |
| 15 | 3.472 | 0.7562 | 3.422 |
| 16 | 3.532 | 0.7499 | 3.482 |
| 17 | 3.588 | 0.7441 | 3.538 |
| 18 | 3.640 | 0.7386 | 3.591 |
| 19 | 3.689 | 0.7335 | 3.640 |
| 20 | 3.735 | 0.7287 | 3.686 |
| 21 | 3.778 | 0.7242 | 3.730 |
| 22 | 3.819 | 0.7199 | 3.771 |
| 23 | 3.858 | 0.7159 | 3.811 |
| 24 | 3.895 | 0.7121 | 3.847 |
| 25 | 3.931 | 0.7084 | 3.883 |
| N | d2(N) |
|---|---|
| 26 | 3.964 |
| 27 | 3.997 |
| 28 | 4.027 |
| 29 | 4.057 |
| 30 | 4.086 |
| 31 | 4.113 |
| 32 | 4.139 |
| 33 | 4.165 |
| 34 | 4.189 |
| 35 | 4.213 |
| 36 | 4.236 |
| 37 | 4.259 |
| 38 | 4.280 |
| 39 | 4.301 |
| 40 | 4.322 |
| 41 | 4.341 |
| 42 | 4.361 |
| 43 | 4.379 |
| 44 | 4.398 |
| 45 | 4.415 |
| 46 | 4.433 |
| 47 | 4.450 |
| 48 | 4.466 |
| 49 | 4.482 |
| 50 | 4.498 |
Unbiasing constant c4'()
Use the following tables to find values for the unbiasing constant, c4'(), which is used in the formulas for the square root of MSSD method of estimating sigma.
| N | c4'(N) | N | c4'(N) | N | c4'(N) |
|---|---|---|---|---|---|
| 2 | 0.797850 | 41 | 0.990797 | 80 | 0.995215 |
| 3 | 0.871530 | 42 | 0.991013 | 81 | 0.995272 |
| 4 | 0.905763 | 43 | 0.991218 | 82 | 0.995328 |
| 5 | 0.925222 | 44 | 0.991415 | 83 | 0.995383 |
| 6 | 0.937892 | 45 | 0.991602 | 84 | 0.995436 |
| 7 | 0.946837 | 46 | 0.991782 | 85 | 0.995489 |
| 8 | 0.953503 | 47 | 0.991953 | 86 | 0.995539 |
| 9 | 0.958669 | 48 | 0.992118 | 87 | 0.995589 |
| 10 | 0.962793 | 49 | 0.992276 | 88 | 0.995638 |
| 11 | 0.966163 | 50 | 0.992427 | 89 | 0.995685 |
| 12 | 0.968968 | 51 | 0.992573 | 90 | 0.995732 |
| 13 | 0.971341 | 52 | 0.992713 | 91 | 0.995777 |
| 14 | 0.973375 | 53 | 0.992848 | 92 | 0.995822 |
| 15 | 0.975137 | 54 | 0.992978 | 93 | 0.995865 |
| 16 | 0.976679 | 55 | 0.993103 | 94 | 0.995908 |
| 17 | 0.978039 | 56 | 0.993224 | 95 | 0.995949 |
| 18 | 0.979249 | 57 | 0.993340 | 96 | 0.995990 |
| 19 | 0.980331 | 58 | 0.993452 | 97 | 0.996030 |
| 20 | 0.981305 | 59 | 0.993561 | 98 | 0.996069 |
| 21 | 0.982187 | 60 | 0.993666 | 99 | 0.996108 |
| 22 | 0.982988 | 61 | 0.993767 | 100 | 0.996145 |
| 23 | 0.983720 | 62 | 0.993866 | 101 | 0.996182 |
| 24 | 0.984391 | 63 | 0.993961 | 102 | 0.996218 |
| 25 | 0.985009 | 64 | 0.994053 | 103 | 0.996253 |
| 26 | 0.985579 | 65 | 0.994142 | 104 | 0.996288 |
| 27 | 0.986107 | 66 | 0.994229 | 105 | 0.996322 |
| 28 | 0.986597 | 67 | 0.994313 | 106 | 0.996356 |
| 29 | 0.987054 | 68 | 0.994395 | 107 | 0.996389 |
| 30 | 0.987480 | 69 | 0.994474 | 108 | 0.996421 |
| 31 | 0.987878 | 70 | 0.994551 | 109 | 0.996452 |
| 32 | 0.988252 | 71 | 0.994626 | 110 | 0.996483 |
| 33 | 0.988603 | 72 | 0.994699 | 111 | 0.996514 |
| 34 | 0.988934 | 73 | 0.994769 | 112 | 0.996544 |
| 35 | 0.989246 | 74 | 0.994838 | 113 | 0.996573 |
| 36 | 0.989540 | 75 | 0.994905 | 114 | 0.996602 |
| 37 | 0.989819 | 76 | 0.994970 | 115 | 0.996631 |
| 38 | 0.990083 | 77 | 0.995034 | 116 | 0.996658 |
| 39 | 0.990333 | 78 | 0.995096 | 117 | 0.996686 |
| 40 | 0.990571 | 79 | 0.995156 | 118 | 0.996713 |
| N | c4'(N) | N | c4'(N) | N | c4'(N) |
|---|---|---|---|---|---|
| 119 | 0.996739 | 160 | 0.997541 | 201 | 0.998016 |
| 120 | 0.996765 | 161 | 0.997555 | 202 | 0.998025 |
| 121 | 0.996791 | 162 | 0.997570 | 203 | 0.998034 |
| 122 | 0.996816 | 163 | 0.997584 | 204 | 0.998043 |
| 123 | 0.996841 | 164 | 0.997598 | 205 | 0.998052 |
| 124 | 0.996865 | 165 | 0.997612 | 206 | 0.998061 |
| 125 | 0.996889 | 166 | 0.997625 | 207 | 0.998070 |
| 126 | 0.996913 | 167 | 0.997639 | 208 | 0.998078 |
| 127 | 0.996936 | 168 | 0.997652 | 209 | 0.998087 |
| 128 | 0.996959 | 169 | 0.997665 | 210 | 0.998095 |
| 129 | 0.996982 | 170 | 0.997678 | 211 | 0.998104 |
| 130 | 0.997004 | 171 | 0.997691 | 212 | 0.998112 |
| 131 | 0.997026 | 172 | 0.997703 | 213 | 0.998120 |
| 132 | 0.997047 | 173 | 0.997716 | 214 | 0.998128 |
| 133 | 0.997069 | 174 | 0.997728 | 215 | 0.998137 |
| 134 | 0.997089 | 175 | 0.997741 | 216 | 0.998145 |
| 135 | 0.997110 | 176 | 0.997753 | 217 | 0.998152 |
| 136 | 0.997130 | 177 | 0.997765 | 218 | 0.998160 |
| 137 | 0.997150 | 178 | 0.997776 | 219 | 0.998168 |
| 138 | 0.997170 | 179 | 0.997788 | 220 | 0.998176 |
| 139 | 0.997189 | 180 | 0.997800 | 221 | 0.998184 |
| 140 | 0.997209 | 181 | 0.997811 | 222 | 0.998191 |
| 141 | 0.997227 | 182 | 0.997822 | 223 | 0.998199 |
| 142 | 0.997246 | 183 | 0.997834 | 224 | 0.998206 |
| 143 | 0.997264 | 184 | 0.997845 | 225 | 0.998214 |
| 144 | 0.997282 | 185 | 0.997856 | 226 | 0.998221 |
| 145 | 0.997300 | 186 | 0.997866 | 227 | 0.998228 |
| 146 | 0.997318 | 187 | 0.997877 | 228 | 0.998235 |
| 147 | 0.997335 | 188 | 0.997888 | 229 | 0.998242 |
| 148 | 0.997352 | 189 | 0.997898 | 230 | 0.998250 |
| 149 | 0.997369 | 190 | 0.997909 | 231 | 0.998257 |
| 150 | 0.997386 | 191 | 0.997919 | 232 | 0.998263 |
| 151 | 0.997402 | 192 | 0.997929 | 233 | 0.998270 |
| 152 | 0.997419 | 193 | 0.997939 | 234 | 0.998277 |
| 153 | 0.997435 | 194 | 0.997949 | 235 | 0.998284 |
| 154 | 0.997450 | 195 | 0.997959 | 236 | 0.998291 |
| 155 | 0.997466 | 196 | 0.997969 | 237 | 0.998297 |
| 156 | 0.997481 | 197 | 0.997978 | 238 | 0.998304 |
| 157 | 0.997497 | 198 | 0.997988 | 239 | 0.998311 |
| 158 | 0.997512 | 199 | 0.997997 | 240 | 0.998317 |
| 159 | 0.997526 | 200 | 0.998007 | 241 | 0.998323 |
| N | c4'(N) | N | c4'(N) | N | c4'(N) |
|---|---|---|---|---|---|
| 242 | 0.998330 | 283 | 0.998553 | 324 | 0.998720 |
| 243 | 0.998336 | 284 | 0.998558 | 325 | 0.998723 |
| 244 | 0.998342 | 285 | 0.998562 | 326 | 0.998727 |
| 245 | 0.998349 | 286 | 0.998567 | 327 | 0.998730 |
| 246 | 0.998355 | 287 | 0.998571 | 328 | 0.998734 |
| 247 | 0.998361 | 288 | 0.998576 | 329 | 0.998737 |
| 248 | 0.998367 | 289 | 0.998580 | 330 | 0.998740 |
| 249 | 0.998373 | 290 | 0.998585 | 331 | 0.998744 |
| 250 | 0.998379 | 291 | 0.998589 | 332 | 0.998747 |
| 251 | 0.998385 | 292 | 0.998593 | 333 | 0.998751 |
| 252 | 0.998391 | 293 | 0.998598 | 334 | 0.998754 |
| 253 | 0.998397 | 294 | 0.998602 | 335 | 0.998757 |
| 254 | 0.998403 | 295 | 0.998606 | 336 | 0.998761 |
| 255 | 0.998408 | 296 | 0.998611 | 337 | 0.998764 |
| 256 | 0.998414 | 297 | 0.998615 | 338 | 0.998767 |
| 257 | 0.998420 | 298 | 0.998619 | 339 | 0.998770 |
| 258 | 0.998425 | 299 | 0.998623 | 340 | 0.998774 |
| 259 | 0.998431 | 300 | 0.998627 | 341 | 0.998777 |
| 260 | 0.998436 | 301 | 0.998632 | 342 | 0.998780 |
| 261 | 0.998442 | 302 | 0.998636 | 343 | 0.998783 |
| 262 | 0.998447 | 303 | 0.998640 | 344 | 0.998786 |
| 263 | 0.998453 | 304 | 0.998644 | 345 | 0.998790 |
| 264 | 0.998458 | 305 | 0.998648 | 346 | 0.998793 |
| 265 | 0.998463 | 306 | 0.998652 | 347 | 0.998796 |
| 266 | 0.998469 | 307 | 0.998656 | 348 | 0.998799 |
| 267 | 0.998474 | 308 | 0.998660 | 349 | 0.998802 |
| 268 | 0.998479 | 309 | 0.998664 | 350 | 0.998805 |
| 269 | 0.998484 | 310 | 0.998668 | 351 | 0.998808 |
| 270 | 0.998489 | 311 | 0.998671 | 352 | 0.998811 |
| 271 | 0.998495 | 312 | 0.998675 | 353 | 0.998814 |
| 272 | 0.998500 | 313 | 0.998679 | 354 | 0.998817 |
| 273 | 0.998505 | 314 | 0.998683 | 355 | 0.998820 |
| 274 | 0.998510 | 315 | 0.998687 | 356 | 0.998823 |
| 275 | 0.998515 | 316 | 0.998690 | 357 | 0.998826 |
| 276 | 0.998519 | 317 | 0.998694 | 358 | 0.998829 |
| 277 | 0.998524 | 318 | 0.998698 | 359 | 0.998832 |
| 278 | 0.998529 | 319 | 0.998701 | 360 | 0.998835 |
| 279 | 0.998534 | 320 | 0.998705 | 361 | 0.998837 |
| 280 | 0.998539 | 321 | 0.998709 | 362 | 0.998840 |
| 281 | 0.998544 | 322 | 0.998712 | 363 | 0.998843 |
| 282 | 0.998548 | 323 | 0.998716 | 364 | 0.998846 |
| N | c4'(N) | N | c4'(N) | N | c4'(N) |
|---|---|---|---|---|---|
| 365 | 0.998849 | 411 | 0.998963 | 457 | 0.999054 |
| 366 | 0.998851 | 412 | 0.998965 | 458 | 0.999056 |
| 367 | 0.998854 | 413 | 0.998967 | 459 | 0.999058 |
| 368 | 0.998857 | 414 | 0.998970 | 460 | 0.999060 |
| 369 | 0.998860 | 415 | 0.998972 | 461 | 0.999061 |
| 370 | 0.998862 | 416 | 0.998974 | 462 | 0.999063 |
| 371 | 0.998865 | 417 | 0.998976 | 463 | 0.999065 |
| 372 | 0.998868 | 418 | 0.998978 | 464 | 0.999067 |
| 373 | 0.998871 | 419 | 0.998980 | 465 | 0.999068 |
| 374 | 0.998873 | 420 | 0.998982 | 466 | 0.999070 |
| 375 | 0.998876 | 421 | 0.998985 | 467 | 0.999072 |
| 376 | 0.998879 | 422 | 0.998987 | 468 | 0.999073 |
| 377 | 0.998881 | 423 | 0.998989 | 469 | 0.999075 |
| 378 | 0.998884 | 424 | 0.998991 | 470 | 0.999077 |
| 379 | 0.998886 | 425 | 0.998993 | 471 | 0.999078 |
| 380 | 0.998889 | 426 | 0.998995 | 472 | 0.999080 |
| 381 | 0.998892 | 427 | 0.998997 | 473 | 0.999082 |
| 382 | 0.998894 | 428 | 0.998999 | 474 | 0.999084 |
| 383 | 0.998897 | 429 | 0.999001 | 475 | 0.999085 |
| 384 | 0.998899 | 430 | 0.999003 | 476 | 0.999087 |
| 385 | 0.998902 | 431 | 0.999005 | 477 | 0.999088 |
| 386 | 0.998904 | 432 | 0.999007 | 478 | 0.999090 |
| 387 | 0.998907 | 433 | 0.999009 | 479 | 0.999092 |
| 388 | 0.998909 | 434 | 0.999011 | 480 | 0.999093 |
| 389 | 0.998912 | 435 | 0.999013 | 481 | 0.999095 |
| 390 | 0.998914 | 436 | 0.999015 | 482 | 0.999097 |
| 391 | 0.998917 | 437 | 0.999017 | 483 | 0.999098 |
| 392 | 0.998919 | 438 | 0.999019 | 484 | 0.999100 |
| 393 | 0.998921 | 439 | 0.999021 | 485 | 0.999101 |
| 394 | 0.998924 | 440 | 0.999023 | 486 | 0.999103 |
| 395 | 0.998926 | 441 | 0.999025 | 487 | 0.999104 |
| 396 | 0.998929 | 442 | 0.999027 | 488 | 0.999106 |
| 397 | 0.998931 | 443 | 0.999028 | 489 | 0.999108 |
| 398 | 0.998933 | 444 | 0.999030 | 490 | 0.999109 |
| 399 | 0.998936 | 445 | 0.999032 | 491 | 0.999111 |
| 400 | 0.998938 | 446 | 0.999034 | 492 | 0.999112 |
| 401 | 0.998940 | 447 | 0.999036 | 493 | 0.999114 |
| 402 | 0.998943 | 448 | 0.999038 | 494 | 0.999115 |
| 403 | 0.998945 | 449 | 0.999040 | 495 | 0.999117 |
| 404 | 0.998947 | 450 | 0.999042 | 496 | 0.999118 |
| 405 | 0.998950 | 451 | 0.999043 | 497 | 0.999120 |
| 406 | 0.998952 | 452 | 0.999045 | 498 | 0.999121 |
| 407 | 0.998954 | 453 | 0.999047 | 499 | 0.999123 |
| 408 | 0.998956 | 454 | 0.999049 | 500 | 0.999124 |
| 409 | 0.998959 | 455 | 0.999051 | ||
| 410 | 0.998961 | 456 | 0.999052 |
Box-Cox
Box-Cox formula
If you use a Box-Cox transformation, Minitab transforms the original data values (Yi) according to the following formula:


where λ is the parameter for the transformation. Minitab then creates a control chart of the transformed data values (Wi). To learn how Minitab chooses the optimal value for λ, go to Methods and formulas for Box-Cox Transformation.
Common λ values
| λ | Transformation |
|---|---|
| 2 |  |
| 0.5 |  |
| 0 |  |
| −0.5 |  |
| −1 |  |
