In This Topic
Plotted points
The plotted points on the Acceptance I chart are the individual observations. Red points indicate observations that fail Test 1 because they are outside an acceptance control limit. A point outside an acceptance control limit indicates that the process mean shifted far enough toward the corresponding specification limit that the accepted percentage of process output outside the specification limit might be exceeded.
The plotted points on the MR chart are the moving ranges. The moving range is the absolute value of the difference between two or more consecutive points. Red points indicate moving ranges that fail at least one of Tests 1 through 4. Investigate these points for possible special-cause variation.
Center line
The center line on the Acceptance I chart is an estimate of the process average. The observations do not need to remain randomly distributed around the center line.
The center line on the MR chart is the average of all moving ranges. Use the center line to compare each moving range to the typical process variation. If the process variation is in control, then the points vary randomly around the center line.
CAUTION
Do not confuse the center line with the target value for your process. The target is your desired outcome. The center line is the actual outcome.
Control limits
The acceptance control limits on the Acceptance I chart indicate when the process mean shifts far enough toward a specification limit that the accepted percentage of process output outside the specification limit might be exceeded. The limits are based on the specification limits, the accepted percentage outside each specification limit, the probability of intervention, and the estimated process variation.
The Acceptance I chart displays a lower acceptance control limit, an upper acceptance control limit, or both, depending on which specification limits you enter. The acceptance control limits are not necessarily the same distance from the center line.
The control limits on the MR chart show the amount of variation that is expected in the moving ranges. If the process variation is in control, then the points vary randomly within the control limits.
CAUTION
Do not confuse acceptance control limits with specification limits. Specification limits define the acceptable values for individual process output. Acceptance control limits indicate when to investigate a shift in the process mean.
Tests for special causes
Acceptance I chart
Only Test 1 applies to the Acceptance I chart. Test 1 identifies observations that are outside the acceptance control limits. These points indicate that the process mean shifted far enough toward the corresponding specification limit that the accepted percentage of process output outside the specification limit might be exceeded.
MR chart
Tests 1 through 4 apply to the MR chart. Use these tests to identify specific patterns in the moving ranges that might indicate special-cause variation.
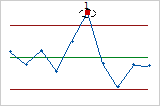
- Test 1: One point more than 3σ from the center line
- Test 1 identifies moving ranges that are unusual compared to other moving ranges. If small shifts in process variation are of interest, you can use Test 2 to supplement Test 1 to increase the sensitivity of the chart.
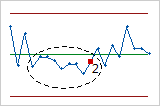
- Test 2: Nine points in a row on the same side of the center line
- Test 2 identifies shifts in the process variation.
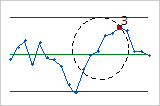
- Test 3: Six points in a row, all increasing or all decreasing
- Test 3 detects trends. This test looks for a long series of consecutive points that consistently increase or decrease.
- Test 4: Fourteen points in a row, alternating up and down
- Test 4 detects systematic variation. A point that fails Test 4 might indicate that the pattern of variation is predictable.
Note
When you use several tests on the MR chart at the same time, the sensitivity of the chart increases. However, the false alarm rate also increases, which can make you react to the test results unnecessarily.
Standard deviation
The standard deviation estimates the process variation among individual observations. Smaller values indicate that the observations are more consistent.
Minitab uses the standard deviation, together with the specification limits, the accepted percentage outside each specification limit, and the probability of intervention, to calculate the acceptance control limits on the Acceptance I chart. Minitab does not display the standard deviation on the chart.
To store the standard deviation in the worksheet, select it on the Storage tab of the Options dialog box.
Stages
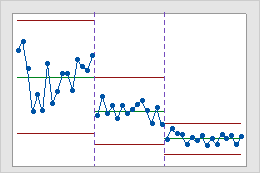
Use stages to create a historical control chart that shows how a process changes over specific periods of time. By default, Minitab recalculates the center line and control limits for each stage. For more information, go to Add stages to show how a process changed.
Interpretation
This historical control chart shows three stages of a process, which represent before, during, and after the implementation of a new procedure.