- Potential capability
- Potential capability is often called the "entitlement" of your process: it ignores differences between subgroups and represents how the process could perform if the shift and drift between subgroups were eliminated. Capability indices that assess potential capability include Cp, CPU, CPL, and Cpk.
- Overall capability
- Overall capability is what the customer experiences over time; it captures the overall variation of the process, including the differences between subgroups. Capability indices that assess overall capability include Pp, PPU, PPL, Ppk, and Cpm.
Example of overall process variation and within-subgroup variation
A candy factory has a machine that fills containers with a certain weight of candy. Candy shipments leave the factory each day. To assess the capability of this process, a technician weighs a sample of bags every 6 hours. Each sample represents a subgroup in your analysis.
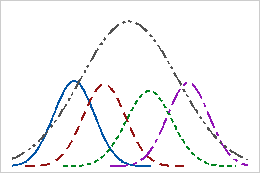
Although the variation within each subgroup is small, the overall variation of weight of all bags is much greater. Thus, the entire daily shipment has larger variation in bag weight than the bags produced throughout the day.

Potential and overall capability
The smaller distribution curves represent the distribution of bag weight for each of sample. The single, larger distribution curve represents the entire day's shipment, which is an aggregate of the subgroups.
Overall capability is based on the variation of all the process data taken as a whole, which is shown by the large curve. It indicates the actual performance of the process that the customer experiences and is sometimes called actual capability or long-term capability.
Potential capability considers only the variation within subgroups, which is shown by the smaller curves. It indicates how well your process could perform if you eliminated variation between subgroups. It is sometimes called short-term capability.
Note
Potential capability is only calculated for normal data.
You can assess the effect of variation between subgroups by comparing potential and overall capability. If the difference between them is large, there is likely a high amount of variation between the subgroups and the stability of your process may need improvement.
