When you perform a capability analysis for measurement data, Minitab evaluates both the observed and expected performance of your process.
- Observed performance
- The observed performance uses only your sample data to calculate the actual number of nonconforming parts in the sample that are outside the specification limits.
- Expected performance
- The expected performance is based on the overall distribution that is fit to your data and estimates the nonconforming parts that you can expect to be outside the specification limits. Expected values are projections or extrapolations based on the cumulative distribution function and are used to estimate both the potential and overall capability of a process.
Example of observed performance and expected performance
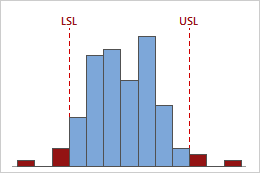
Observed Performance: PPM Total
The red bars on this histogram show the total number of observed nonconforming parts in the sample.
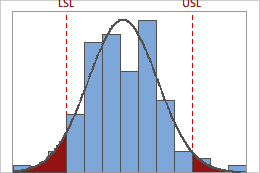
Expected Performance: PPM Total
The red shaded area of this histogram show the probability that a randomly selected part is outside of the specification limits. Therefore it estimates the number of expected nonconforming parts in the process over time, based on a normal distribution.