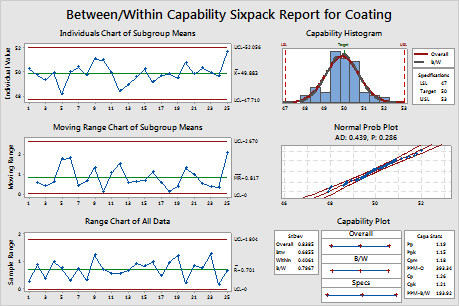
An engineer wants to assess the capability of a process that coats large rolls of paper with a thin film. The engineer collects three measurements of coating thickness from 25 consecutive rolls. Because the machine is reset for each new roll, the engineer needs to consider variation between rolls in addition to variation within a roll. The film thickness must be 50 ± 3 microns to meet engineering specifications.
The engineer performs between/within capability sixpack to check the assumptions for between/within capability analysis and to evaluate how well the coating thickness meets customer requirements.
- Open the sample data, FilmThickness.MWX.
- Choose .
- In Single column, enter Coating.
- In Subgroup size, enter Roll.
- In Lower spec, enter 47.
- In Upper spec, enter 53.
- Click Options.
- In Target (adds Cpm to table), enter 50.
- Click OK in each dialog box.
Interpret the results
The Individuals, Moving Range, and Range charts indicate that the process is stable, with no points beyond the control limits. The normal probability plot indicates that data are normally distributed. Therefore, the assumptions for between/within capability analysis are satisfied and the capability of the process can be analyzed.
The capability histogram shows that the process is approximately centered and the measurements are within the specification limits. For between/within capability, Cp is 1.26, which indicates that the specification spread is 1.26 times greater than the 6-σ spread in the process. Cp (1.26) and Cpk (1.21) are very close to each other, indicating that the process is approximately centered. For overall capability, Pp (1.19), Ppk (1.15), and Cpm (1.18) are very close to each other, indicating that the process is centered and on target. However, Ppk is slightly less than 1.33, which is a generally accepted minimum value for a capable process. The engineer concludes that the process is almost capable of applying coating that conforms to specifications; however, its capability could be improved.

