In This Topic
U Chart
For information on the methods used to create the U chart, go to Methods and formulas for U Chart.
Cumulative DPU
The number of plot points equals the number of samples in your study.
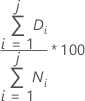
The cumulative DPU for the jth sample is calculated as follows:
The reference lines on the plot are calculated as follows:
- Middle reference line: Mean DPU. For more information, go to Methods and formulas for capability statistics in Poisson Capability Analysis and click "Mean DPU".
- Upper reference line: Upper bound for the Mean DPU
- Lower reference line: Lower bound for the Mean DPU
For more information on the confidence bounds, go to Methods and formulas for confidence intervals and bounds in Poisson Capability Analysis.
Notation
| Term | Description |
|---|---|
| Di | Number of defectives in the ith sample |
| Ni | The ith sample size |