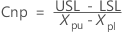
Overall capability measures
- Cnp
-
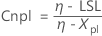
- Cnpl
-
- Cnpu
-

- Cnpk
- Cnpk = min{Cnpl, Cnpu}
Notation
| Term | Description |
|---|---|
| USL | Upper specification limit |
| LSL | Lower specification limit |
| η | Process median |
| Xpu | Upper empirical percentile from the tolerance |
| Xpl | Lower empirical percentile from the tolerance |
Empirical percentiles
The analysis uses the empirical percentiles to estimate the spread of the process. First, the analysis uses the tolerance to find the percentiles to calculate.


where Z is a percentile from the standard normal distribution and T is the tolerance. For example, if the tolerance is 6, then pU = P(Z < 3) = 0.99865. If the tolerance is 6, then pL = P(Z < −3) = 0.00135. For a process with 2 specification limits, a tolerance of 6 covers approximately 99.7% of the data.
Next, the analysis calculates the empirical percentiles from the data.

- Notation
-
Term Description p the percentage of data less than or equal to the desired percentile, divided by 100 Xy the yth row of the data when the data are sorted from least to greatest y the truncated value of w w p(N + 1) N the number of rows with nonmissing data z w – y
References
McCormack, D. W., Harris, I. R., Hurwitz, A., M., & Spagon, P. D. (2000). Capability indices for non-normal data. Quality Engineering, 12(4), 489-495.