In This Topic
PPM < LSL for Observed Performance
The number of parts out of one million that have measurements that are less than the lower specification limit is calculated as follows:

Notation
| Term | Description |
|---|---|
| LSL | Lower specification limit |
| N | Total number of observations |
PPM > USL for Observed Performance
The number of parts out of one million that have measurements that are greater than the upper specification limit is calculated as follows:

Notation
| Term | Description |
|---|---|
| USL | Upper specification limit |
| N | Total number of observations |
PPM Total for Observed Performance
The total number of parts out of a million that are outside the specification limits is calculated as follows:


Notation
| Term | Description |
|---|---|
| LSL | Lower specification limit |
| USL | Upper specification limit |
| N | Total number of observations |
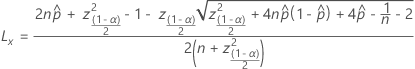
Confidence intervals for PPM and % out of specification
The calculation of the confidence interval is the same for PPM and percent except for a
step at the end to convert the result to the correct units. The following formulas are
for the two-sided 100(1 –  )% confidence intervals. To find
one-sided confidence intervals, replace
)% confidence intervals. To find
one-sided confidence intervals, replace  with (1 –
  ).
).

To convert the result of the formula to PPM, multiply by 1,000,000.
To convert the result of the formula to percentage, multiply by 100.
If no observed units are outside of a specification limit, then the lower confidence bound is 0. If all the observed units are outside of a specification limit, then the upper confidence bound is 1.
Notation
| Term | Description |
|---|---|
 | Lower confidence bound |
 | Upper confidence bound |
| n | Total number of units |
 | Empirical probability that a unit is out of specification: defectives / total. |
 | (1 –  )/2 percentile from a standard normal distribution )/2 percentile from a standard normal distribution |
 | 1 – the confidence level |
References
Newcombe, R. G. (1998). Two-sided confidence intervals for the single proportion: comparison of seven methods. Statistics in Medicine, 17(8), 857-872.
Tong, L. I., & Chen, J. P. (1998). Lower confidence limits of process capability indices for nonnormal process distributions. International Journal of Quality & Reliability Management, 15(8/9), 907-919.