In This Topic
Step 1: Examine the observed performance of your process
Use the capability histogram to examine the sample observations in relation to the process requirements.
Examine the process spread
Visually examine the data in the histogram in relation to the lower and upper specification limits. Ideally, the spread of the data is narrower than the specification spread, and all the data are inside the specification limits. Data that are outside the specification limits represent nonconforming items.
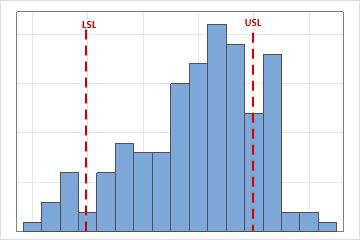
In this histogram, the process spread is wider than the specification spread, which suggests poor capability. Although most of the data are within the specification limits, many nonconforming items are below the lower specification limit (LSL) or above the upper specification limit (USL).
Note
To determine the actual number of nonconforming items in your process, use the results for PPM < LSL, PPM > USL, and PPM Total. For more information, go to Observed performance for Nonparametric Capability Analysis.
Assess the location of the process
Evaluate whether the process is centered between the specification limits or at the target value, if you have one. The peak of the distribution curve shows where most of the data are located.
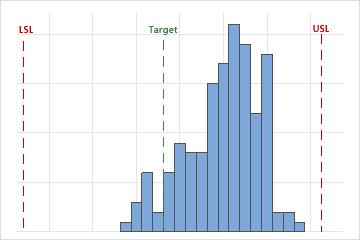
In this histogram, although the sample observations fall inside the specification limits, the peak of the distribution curve is not on the target. Most of the data exceed the target value and are located near the upper specification limit.
Step 2: Evaluate the capability of the process
Use Cnpk to evaluate the overall capability of your process based on both the process location and the process spread. Overall capability indicates the actual performance of your process that your customer experiences over time.
Generally, higher Cnpk values indicate a more capable process. Lower Cnpk values indicate that your process may need improvement.
Compare Cnpk to a benchmark value that represents the minimum value that is acceptable for your process. Many industries use a benchmark value of 1.33. If Cnpk is lower than your benchmark, consider ways to improve your process.
Key Result: Cnpk
For these process data, Cnpk = 0.25. Because Cnpk is less than 1.33, the overall capability of the process does not meet customer requirements. You should take steps to improve the process.
Important
The Cnpk index represents the process capability for only the "worst" side of the process measurements, with respect to either the lower or the upper specification limit. If your process produces nonconforming items that fall outside both the lower and upper specification limits, use additional capability measures in the output to more fully assess process performance. For more information, go to Overall capability for Nonparametric Capability Analysis.