LSL
The lower specification limit (LSL) of the process is the minimum allowed value for the product or service. This limit does not indicate how the process is performing but how you want it to perform. You specify LSL when you set up the capability analysis.
Interpretation
Use the USL and LSL to define customer requirements and to evaluate whether your process produces items that meet the requirements.
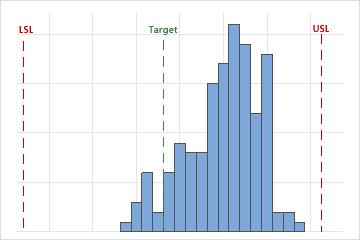
The upper and lower specification limits are identified by the vertical dashed lines on the histogram. Compare the histogram bars to the lines to assess whether the measurements are within the specification limits.
The specification spread is the distance between the upper specification limit and the lower specification limit (USL – LSL). Suppose a company produces ball point pens and the target outer diameter for the ball is 0.35 mm. The acceptable range for ball outer diameters is 0.34 to 0.36 mm. Therefore, the LSL is 0.34, the USL is 0.36, and the specification spread is 0.02 mm.
Minitab compares the specification spread to the process spread to determine your process capability.
Target
The target is the ideal value of a process based on your customer requirements. For example, if a cylindrical part produces optimal performance in a product when the diameter is 32 mm, then 32 mm is the target for this part.
Interpretation
Use the target to define customer requirements and to compare with your observations.
The target value is usually, but not always, centered between the lower and upper specification limits. When you have a target, examine whether your process is centered near the target.
USL
The upper specification limit (USL) of the process is the maximum allowed value for the product or service. This limit does not indicate how the process is performing but how you want it to perform. You specify USL when you set up the capability analysis.
Interpretation
Use the USL and LSL to define customer requirements and to evaluate whether your process produces items that meet the requirements.
The upper and lower specification limits are identified by the vertical dashed lines on the histogram. Compare the histogram bars to the lines to assess whether the measurements are within the specification limits.
The specification spread is the distance between the upper specification limit and the lower specification limit (USL – LSL). Suppose a company produces ball point pens and the target outer diameter for the ball is 0.35 mm. The acceptable range for ball outer diameters is 0.34 to 0.36 mm. Therefore, the LSL is 0.34, the USL is 0.36, and the specification spread is 0.02 mm.
Minitab compares the specification spread to the process spread to determine your process capability.
Sample median
The sample median is the midpoint of the data set. This midpoint value is the point at which half the observations are above the value and half the observations are below the value. The median is determined by ranking the observations and finding the observation that are at the number [N + 1] / 2 in the ranked order. If the number of observations are even, then the median is the average value of the observations that are ranked at numbers N / 2 and [N / 2] + 1.
Interpretation
Use the sample median to estimate the median value of your process. In most data, the median is a good estimate of typical data from the process. Usually, you want the median to be close to the process target.
For data that follow a symmetric, bell-shaped distribution, the sample mean is usually a good estimate of typical data from the process. For data that do not follow a symmetric, bell-shaped distribution, the sample mean is sometimes far away from the typical data. The sample median is a better representation of typical data when the mean is far from the typical data.
Sample mean
The sample mean is the average of the sample measurements.
Interpretation
Use the sample mean to estimate the average value of your process. Usually, you want the mean to be close to the process target.
For data that follow a symmetric, bell-shaped distribution, the sample mean is usually a good estimate of typical data from the process. For data that do not follow a symmetric, bell-shaped distribution, the sample mean is sometimes far away from the typical data. The sample median is a better representation of typical data when the mean is far from the typical data.
Sample standard deviation
Sample standard deviation is the standard deviation of all the measurements and is an estimate of the overall variation of the process. If your data are collected properly, the overall standard deviation captures all sources of systemic variation. In that case, it represents the actual variation of the process that the customer experiences over time.
Interpretation
The standard deviation is the most common measure of dispersion, or how spread out the data are from the mean. A larger sample standard deviation indicates that your data are spread more widely around the mean. Usually, the same process is more capable with a smaller standard deviations than with a larger standard deviation.
Sample N
The sample size (N) is the total number of observations in your data. For example, if you collected 20 subgroups of size 5, your sample N is 100.
Interpretation
Use N to assess your sample size.
Generally, larger sample sizes produce more reliable estimates of process capability. Some experts recommend at least 100 total observations for a capability analysis.