Cnp
- The specification spread (USL – LSL)
- The spread of the process
You must provide both a lower specification limit (LSL) and an upper specification limit (USL) to calculate the Cnp index.
Interpretation
Use Cnp to evaluate the capability of your process based on the process spread. This estimate of capability indicates the actual performance of your process that your customer experiences over time.
Because Cnp does not consider the location of the process, it indicates the overall capability that your process could achieve if it were centered. Generally, higher Cnp values indicate a more capable process. Lower Cnp values indicate that your process may need improvement.
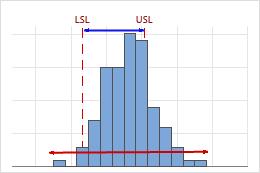
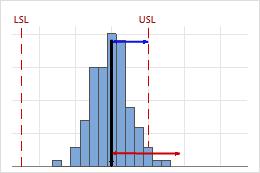
Low Cnp
In this example, the specification spread is less than the overall process spread. Therefore, Cnp is low (0.40), and the overall capability of the process is poor based on its variability.
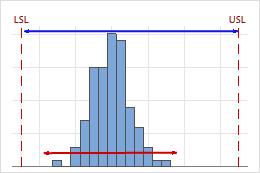
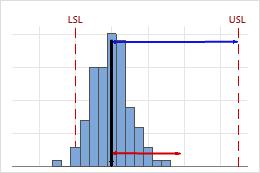
High Cnp
In this example, the specification spread is considerably greater than the overall process spread. Therefore, Cnp is high (1.80), and the overall capability of the process is good based on its variability.
-
Compare Cnp to a benchmark value to assess the overall capability of your process. Many industries use a benchmark value of 1.33. If Cnp is lower than your benchmark, consider how to improve your process by reducing its variation.
-
Compare Cnp and Cnpk. If Cnp and Cnpk are approximately equal, then the process is centered between the specification limits. If Cnp and Cnpk differ, then the process is not centered.
Caution
Cnp = 2.27
Cnp = 2.27
For a complete and accurate analysis, use graphs in combination with other capability indices (such as Cnpk) to draw meaningful conclusions from your data.
Cnpl
- The one-sided specification spread, from the process median to the lower specification limit
- One-half the process spread, from the process median to the estimate of the lower end of the process
Because Cnpl uses information about both the process median and the process spread, it evaluates both the location and the variation of the process.
Interpretation
Use Cnpl to evaluate the overall capability of your process relative to its lower specification limit. Overall capability indicates the actual performance of your process that your customer experiences over time.
Generally, higher Cnpl values indicate that the process is capable relative to the lower specification limit. Lower Cnpl values indicate that your process may need improvement.
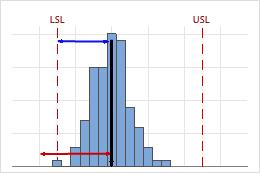
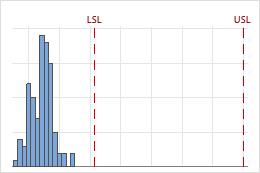
Low Cnpl
In this example, the distance from the process median to the lower specification limit (LSL) is less than the one-sided process spread. Therefore, Cnpl is low (0.80), and the overall capability of the process is poor in relation to its lower specification limit.
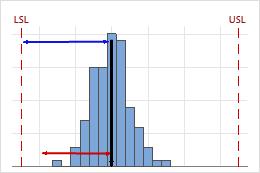
High Cnpl
In this example, the distance from the process median to the lower specification limit (LSL) is greater than the one-sided process spread. Therefore, Cnpl is high (1.60), and the overall capability of the process is good in relation to its lower specification limit.
-
Compare Cnpl to a benchmark value to assess the overall capability of your process. Many industries use a benchmark value of 1.33. If Cnpl is lower than your benchmark, consider ways to improve your process, such as reducing its variation or shifting its location.
-
If you have both lower and upper specification limits, compare Cnpl and Cnpu. If Cnpl does not approximately equal Cnpu, the process is not centered.
Cnpl = 0.92, Cnpu = 4.37
When Cnpl < Cnpu, the process is more likely to produce defective units that violate the lower specification limit.
Cnpl = 4.37, Cnpu = 0.92
When Cnpu < Cnpl, the process is more likely to produce defective units that violate the upper specification limit.
Cnpu
- The one-sided specification spread, from the process median to the upper specification limit
- One-half the process spread, from the process median to the estimate of the upper end of the process
Because Cnpu uses information about both the process median and the process spread, it evaluates both the location and the variation of the process.
Interpretation
Use Cnpu to evaluate the overall capability of your process relative to its upper specification limit. Overall capability indicates the actual performance of your process that your customer experiences over time.
Generally, higher Cnpu values indicate that the process is capable relative to the upper specification limit. Lower Cnpu values indicate that your process may need improvement.
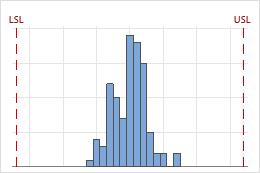
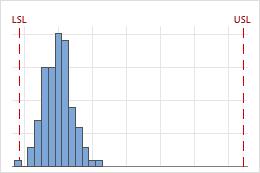
Low Cnpu
In this example, the distance from the process median to the upper specification limit (USL) is less than the one-sided process spread. Therefore, Cnpu is low (0.66), and the overall capability of the process is poor in relation to its upper specification limit.
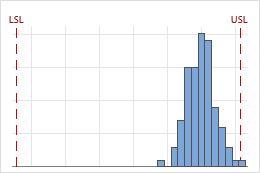
High Cnpu
In this example, the distance from the process median to the upper specification limit (USL) is considerably greater than the one-sided process spread. Therefore, Cnpu is high (2.76), and the overall capability of the process is good in relation to its upper specification limit.
-
Compare Cnpu to a benchmark value to assess the overall capability of your process. Many industries use a benchmark value of 1.33. If Cnpu is lower than your benchmark, consider ways to improve your process, such as reducing its variation or shifting its location.
-
If you have both lower and upper specification limits, compare Cnpl and Cnpu. If Cnpl does not approximately equal Cnpu, the process is not centered.
Cnpl = 0.92, Cnpu = 4.37
When Cnpl < Cnpu, the process is more likely to produce defective units that violate the lower specification limit.
Cnpl = 4.37, Cnpu = 0.92
When Cnpu < Cnpl, the process is more likely to produce defective units that violate the upper specification limit.
Cnpk
- The one-sided specification spread, from the process median to the upper specification limit
- One-half the process spread, from the process median to the estimate of the upper end of the process
- The one-sided specification spread, from the process median to the lower specification limit
- One-half the process spread, from the process median to the estimate of the lower end of the process
Interpretation
Use Cnpk to evaluate the overall capability of your process based on both the process location and the process spread. Overall capability indicates the actual performance of your process that your customer experiences over time.
Generally, higher Cnpk values indicate a more capable process. Lower Cnpk values indicate that your process may need improvement.
Low Cnpk
In this example, the process is performing worse in relation to its upper
specification limit than its lower specification limit. The Cnpk value equals
Cnpu (≈ 0.40), which is low and indicates poor capability.
High Cnpk
In this example, the process is performing worse in relation to its lower specification limit than its upper specification limit. The Cnpk value equals Cnpl (≈ 1.40), which is high and indicates good capability.
-
If Cnpk < 1, then the specification spread is less than the process spread.
-
Compare Cnpk to a benchmark value that represents the minimum value that is acceptable for your process. Many industries use a benchmark value of 1.33. If Cnpk is lower than your benchmark, consider ways to improve your process.
CAUTION
The Cnpk index represents the process capability for only the "worse" side of the process measurements, that is, the side that exhibits poorer process performance. If your process has nonconforming parts that fall on both sides of the specification limits, check the capability graphs and the probabilities of parts outside both specification limits to more fully assess process capability.