What is the probability density function (PDF)?
The probability density function helps identify regions of higher and lower probabilities for values of a random variable.
Example of a discrete PDF
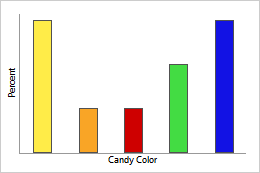
Discrete PDF
This bar chart displays the PDF for candy color. Each bar represents the probability of candies of that color expressed as a percentage.
Example of a continuous PDF
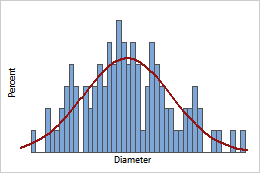
Continuous PDF
The curve is the PDF for cork diameter. Use the PDF to identify regions of higher and lower probabilities for values of a random variable. For example, only a small percentage of corks (1%) have a diameter less than 2.8 cm.
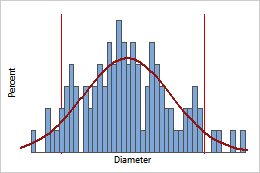
Continuous PDF with specification limits
If the specification limits for cork diameter are 2.85 cm to 3.15 cm, the PDF can indicate the probability density values of all corks from this process that meet the specifications.
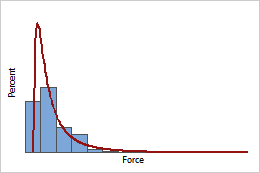
Lognormal PDF
Because a wine bottle occasionally requires an unusual amount of force to remove the cork, measures of this force often follow a distribution with a long right tail such as the lognormal distribution.