Step 1: Look for extreme values
Look for rectangles that have the a color different than the rectangles around it to determine which coordinates have the highest values of the function you chose, which coordinates have the lowest, or both.
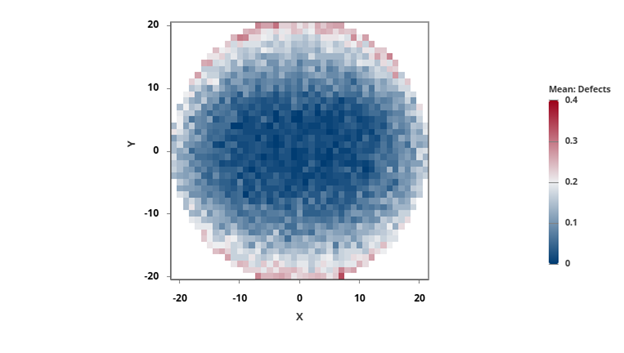
In this example, the rectangle with a Y coordinate of -20 and X coordinate of 7 has a high defect value compared to the ones around it.
Step 2: Look for patterns in your data
Look for specific areas in the wafer plot that have a high concentration of extreme values for the response variable.
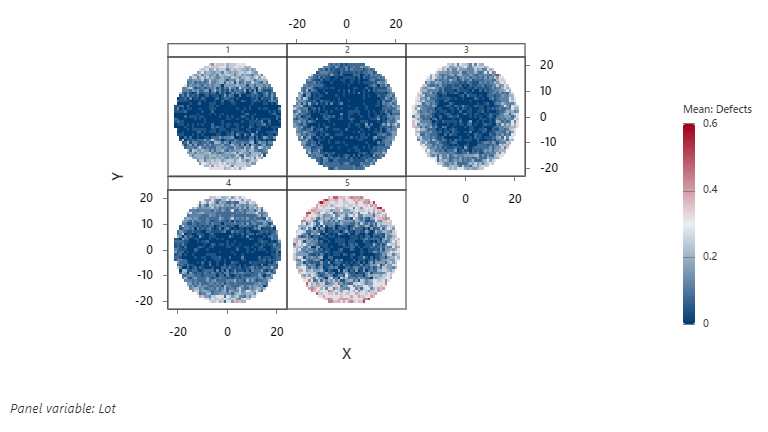
For example, this wafer plot shows the number of defects on dies on semiconductor wafers for 5 different lots. Lot 5 has a large number of defects, specifically dies with very high and very low Y coordinate values. You decide not to use these dies to create semiconductors.