To create a wafer plot, choose , then select Wafer Plot from the list of graphs. Then complete the following steps to specify the data for your graph.
- In Y coordinates, a numeric column with data that represents the y-axis on the wafer plot.
- In X coordinates, enter a numeric column with data that represents the x-axis on the wafer plot.
- In Response variable, enter a numeric column that defines the color gradient of the coordinates in the wafer plot.
- From Function, select the function of the Response variable. For example, if you select Maximum, Minitab defines the color gradient for the wafer plot based on the maximum value of the response variable in each coordinate. Some options require you to enter additional values. For more information, go to Select the function.
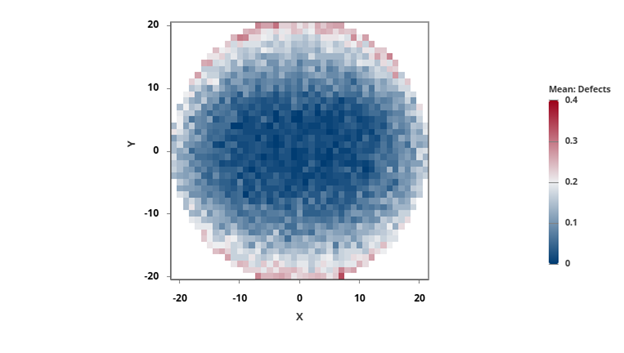
In this worksheet, X is the X coordinate and Y is the Y coordinate. The wafer plot shows the mean of Defects for each combination of the coordinates.
| C1 | C2 | C3 |
|---|---|---|
| X | Y | Defects |
| -21 | -4 | 0 |
| -21 | -3 | 1 |
| -21 | -2 | 0 |
| ... | ... | ... |