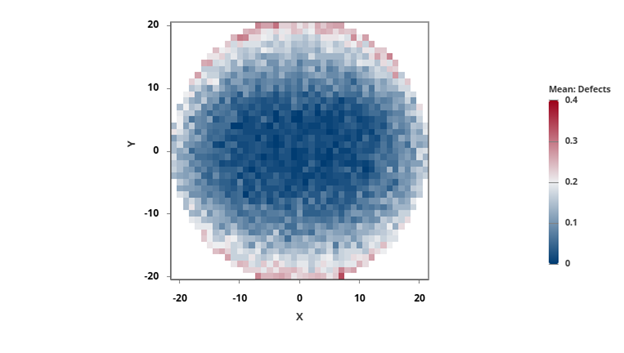
Use a Wafer Plot to compare the means or other summary statistics using a color gradient to represent changes in a response variable.
For example, a manufacturer of semiconductors uses a wafer plot to inspect defects on dies for each X and Y coordinate.
Where to find this graph
To create a wafer plot, choose , then select Wafer Plot from the list of graphs.