A manufacturer of semiconductors wants to inspect dies on semiconductor wafers from 5 different lots. They give each die a X and Y coordinate, then they inspect the number of defects on each die.
- Open the sample data, Semiconductor.MWX.
- Choose then select Wafer Plot from the list of graphs.
- In X coordinates, enter X. In Y coordinates, enter Y.
- In Response variable, enter Defects.
- In By variable , enter Lot. From Layout, select In separate panels of one graph.
- Select Create.
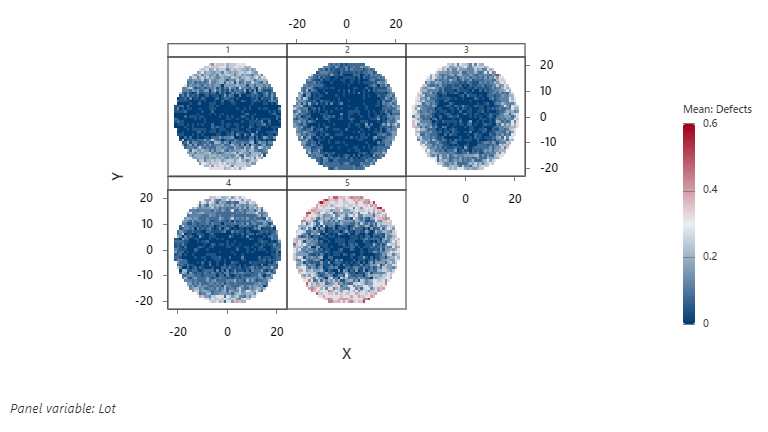
Interpret the results
The manufacturer inspects the wafer plot for areas that contain a high number of defects. Lot 5 has a large number of defects, specifically dies with very high and very low Y coordinate values. The manufacturer determines not to use these dies to produce semiconductors.