Transform a continuous scale to get a different view of your data.
To transform a scale, use the following steps:
- Double-click the graph to open the Options pane. The Options pane provides a subset of the possible graph editing options. For example, you can perform a power transformation, but not a logarithmic transformation.
- Select More Options to open the Edit Graph dialog box and access all the graph editing options.
- Double-click the scale to open the Edit Scale dialog box.
- On the Transform tab, select the appropriate transformation.
- Logarithm
- A logarithmic scale linearizes logarithmic relationships by changing the axis, so that the same distance represents different changes in value across the scale. For example, in the scatterplot with the untransformed x-scale, the function y = ln(x) is not linear. When you transform the x-scale to logarithm base e, the form of the data is linear.
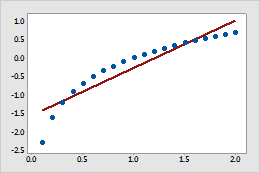
Untransformed x-scale
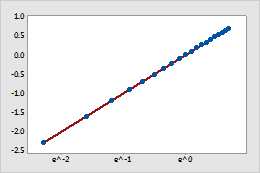
Transformed x-scale (log base e transformation)
Note
You cannot use a logarithmic scale if the data include non-positive values.
- Power
- For a power transformation, the data values are raised to the power that you specify and the scale remains linear. For example, in the scatterplot with the untransformed x-scale, the curvature in the data does not follow the linear fitted regression line. When you perform a power transformation on the x-scale, the data follow the linear fitted regression line.
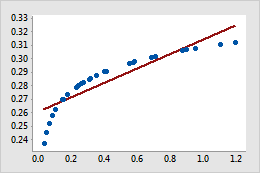
Untransformed x-scale
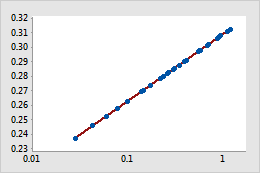
Transformed x-scale (power transformation)
