What is brushing?
- Identify the rows that contain the outliers.
- Determine whether points in a brushing region share other characteristics.
When you brush points in one graph, Minitab automatically brushes points from the same row in all other graphs that are in brushing mode. This is true whether the graphs are in the same output tab or across several output tabs. Brushing across graphs can help you investigate relationships across many variables.
Brushed points are not saved with the project. If you close and reopen the project, brush the points again. Brushing actions are not included in Undo or Redo.
Example of brushing
You create a scatterplot of Yield vs. Input, and notice three points that seem to be outliers. You can brush these points to identify the worksheet rows that correspond to them.
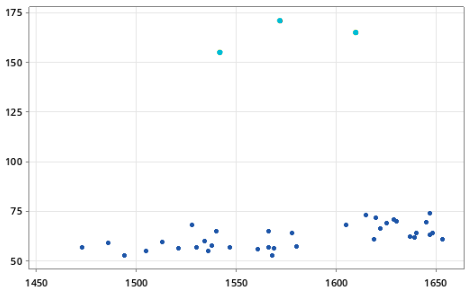
Scatterplot with brushed points
Brushed points are a different color.
When you brush in the desktop app, a pane appears beside the graph. The pane lists the worksheet row numbers of the brushed points and the ID variables, so that you can find them in the worksheet. The ID variables in the example are Yield and Input.
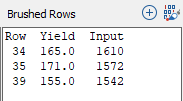
Brushing pane
In the worksheet, Minitab identifies the rows that correspond to the brushed points with symbols beside the row numbers in the desktop app or highlighted rows in the web app.
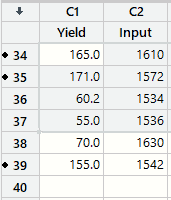
Desktop app
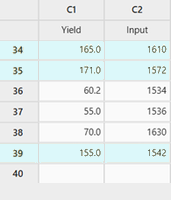
Web app
Worksheet with brushed rows
- Look for data-entry errors and correct them.
- Consider other variables that may explain the high Yield values.
- Recreate your graph excluding (or including) the brushed points, so that you can examine the data you are most interested in.
- Subset your worksheet to exclude (or include) brushed points so that you can analyze the corresponding data.
Brushing in the Minitab desktop app
- In the Minitab desktop app, right-click the graph and choose Brush Points.
- In brushing mode, do any of the following:
- To brush a single point, click it.
- To brush several adjacent points, drag to enclose the points in a brushing region.
- To brush individual points that are not adjacent, press and hold the Shift key while clicking the points.
- To add brushed points to the brushing region, drag the brushing region over them while pressing the Shift key.
- To exit brushing mode, click OK.
Display more information about data points in the Brushing pane
- In the Minitab desktop app, right-click the graph to brush, then choose Brush Points.
- Right-click the graph and choose Set ID Variables.
- In Variables, enter the variables that you want to appear in the Brushing pane.
- Select OK.
Add indicator variables to the worksheet
- In the Minitab desktop app, right-click the graph to brush, then choose Brush Points.
- Right-click the graph and choose Create Indicator Variable.
- In Column, enter a name or column number for the indicator variable column.
- Select OK.
Graph a subset of your data based on brushed points
- In the Minitab desktop app, right-click the graph to brush, then choose Brush Points.
- Brush the points that you want to include or exclude from the new graph. Keep the dialog with the brushed points open for the remaining steps.
- From the menu, choose the graph or control chart that you want to create.
- In the graph creation dialog box, click Data Options.
- On the Subset tab, under Include or Exclude, specify whether you want to include or exclude the brushed rows.
- Under Specify Which Rows To Include, choose Brushed rows.
- Select OK.
Brushing in the Minitab web app
In the web app, you brush points directly on the graph. A worksheet can have only one brushed set at a time. Graphs that use the same worksheet can show and update the same brushed set. For example, you can brush points on a scatterplot, then view the same rows as brushed points on a time series plot that uses the same worksheet.
- To select one point, click the point. Hold Ctrl and click to add individual points to the current selection.
- To select several adjacent points, click and drag to enclose the points. Hold Ctrl and drag to add multiple points to the current selection.
After you make your selection, select Brush Selection. Minitab highlights the points on the graph and the corresponding rows in the worksheet.
Use brushed rows in the worksheet
After you create a brushed set, use the menu in the top right corner of the worksheet to perform actions based on the brushed points.
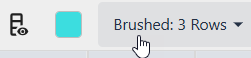
Worksheet menu for brushed rows
- Change the worksheet view to show all rows, show only brushed rows, or hide brushed rows.
- Go to the next or previous brushed row.
- Subset the worksheet based on the brushed rows.
- Delete brushed rows.
- Clear the brushed points.
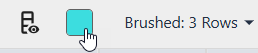
Select the colored square beside the menu to change the color of the brushed points and rows.
Create an indicator variable for brushed rows
- In the Minitab web app, create a brushed set on a graph.
- Right-click the top of the column you want to create the indicator variable in and select Create indicator variable.
By default, the indicator variable stores a value of 1 for brushed rows and 0 for rows that are not brushed. Minitab does not automatically update an existing indicator variable when the brushed set changes. If the brushed set changes, create another indicator variable in the same column or in a different column.
Which graphs can be brushed?
- Scatterplots
- Matrix plots
- Bubble plots
- Marginal plots
- Dotplots (when each symbol represents only one observation)
- Probability plots from the Graph menu
- Empirical CDF plots
- Individual value plots
- Time series plots
- 3D scatterplots
- T-Squared generalized variance charts (when the subgroup size equals 1)
- T-Squared charts (when the subgroup size equals 1)
- Generalized variance charts (when the subgroup size equals 1)
- Variability charts
- Symmetry plots
- Gage run charts
- Trend analysis charts
- Decomposition charts
- Moving average plots
- Single exponential smoothing plots
- Double exponential smoothing plots
- Winters' method plots
- Histograms
- Dotplots (when symbols represent more than one observation)
- Stem-and-leaf plots
- Boxplots
- Interval plots
- Bar charts
- Pie charts
- Area graphs
- Run charts
- Probability distribution plots
- Line plots
- Control charts for individuals
- Control charts for attributes
