Step 1. Determine whether the observed values are statistically different from the expected values
Use the p-value to determine whether to reject or fail to reject the null hypothesis, which states that the population proportions in each category are consistent with the specified values in each category.
- P-value ≤ α: The observed data are statistically different from the expected values (Reject H0)
- If the p-value is less than or equal to the significance level, you reject the null hypothesis and conclude that the data does not follow a distribution with certain proportions. Use your specialized knowledge to determine whether the difference is practically significant.
- P-value > α: You cannot conclude that the observed data are statistically different from the expected values (Fail to reject H0)
- If the p-value is larger than the significance level, you fail to reject the null hypothesis because you do not have enough evidence to conclude that the data do not follow the distribution with specified proportions. However, you cannot conclude that the distributions are the same. A difference might exist, but your test might not have enough power to detect it.
Chi-Square Test
| N | DF | Chi-Sq | P-Value |
|---|---|---|---|
| 225 | 3 | 0.648148 | 0.885 |
Key Result: P-Value
In these results, the p-value is 0.885. Because the p-value is greater than the chosen α value of 0.05, you fail to reject the null hypothesis. Therefore, you cannot conclude that observed proportions are significantly different from the specified proportions.
Step 2. Examine the difference between observed and expected values for each category
Use a bar chart that plots the observed and expected values for each category to determine whether there is a difference in a particular category.
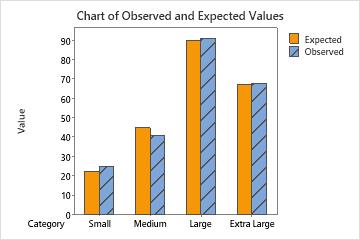
This bar chart indicates that the observed values are very similar to the expected values for each category. Thus, the bar chart visually confirms what the p-value indicates — that you cannot conclude that the observed proportions are significantly different from the specified proportions.