An economist wants to determine whether the monthly energy cost for families has changed from the previous year, when the mean cost per month was $200.
Before collecting the data for a 1-sample t-test, the economist uses a power and sample size calculation to determine how large the sample must be to obtain a power of 90% (0.9). Any difference of at least $100 in either direction is considered to be meaningful and the estimated standard deviation is $150.
- Choose .
- In Differences, enter 100.
- In Power values, enter 0.9.
- In Standard deviation, enter 150.
- Click OK.
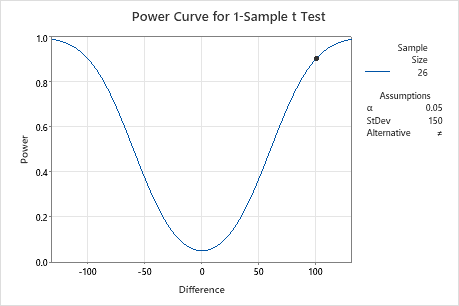
Interpret the results
To detect a difference of 100 with a power of 0.9, the economist needs to collect a sample of 26 observations. This is an obtainable sample size, so the economist continues with the data collection and the 1-sample t-test.
1-Sample t Test
Testing mean = null (versus ≠ null)
Calculating power for mean = null + difference
α = 0.05 Assumed standard deviation = 150
Results
| Difference | Sample Size | Target Power | Actual Power |
|---|---|---|---|
| 100 | 26 | 0.9 | 0.904254 |