An engineer for a vision care company tests a new cleaning solution for contact lenses. The engineer wants to verify that the new solution cleans lenses as well as the leading brand. The engineer has 14 participants wear contact lenses for a day, and then clean the lenses. Each participant cleans one lens in the new solution and the other lens in the leading brand. The engineer assesses the cleanliness of each lens by measuring the angle of contact for a drop of fluid on the lens. The angle of contact is affected by film or deposits on the lens. To be equivalent, the mean angle for the new solution should be within ±0.5 degrees of the mean angle of the leading brand.
The engineer performs an equivalence test with paired data to determine whether the two cleaning solutions are equivalent.
- Open the sample data, ContactLensCleaner.MTW.
- Choose .
- In Test sample, enter New.
- In Reference sample, enter Leading Brand.
- From Hypothesis about, select Test mean - reference mean.
- From What do you want to determine? (Alternative hypothesis), select Lower limit < test mean - reference mean < upper limit.
- In Lower limit, enter -0.5.
- In Upper limit, enter 0.5.
- Click OK.
Interpret the results
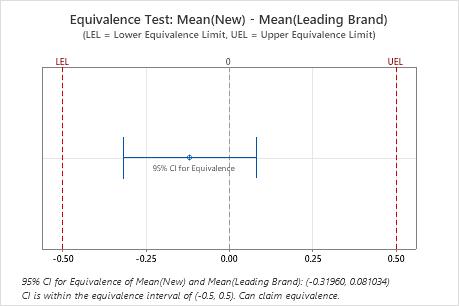
Because the confidence interval is completely within the equivalence interval, the engineer concludes that the two cleaning solutions are equivalent.
Method
Reference mean = mean of Leading Brand
Descriptive Statistics
| Variable | N | Mean | StDev | SE Mean |
|---|---|---|---|---|
| New | 14 | 88.604 | 1.5578 | 0.41634 |
| Leading Brand | 14 | 88.724 | 1.5907 | 0.42514 |
Difference: Mean(New) - Mean(Leading Brand)
| Difference | StDev | SE | 95% CI for Equivalence | Equivalence Interval |
|---|---|---|---|---|
| -0.11929 | 0.42324 | 0.11312 | (-0.319605, 0.0810335) | (-0.5, 0.5) |
Test
| Null hypothesis: | Difference ≤ -0.5 or Difference ≥ 0.5 |
|---|---|
| Alternative hypothesis: | -0.5 < Difference < 0.5 |
| α level: | 0.05 |
| Null Hypothesis | DF | T-Value | P-Value |
|---|---|---|---|
| Difference ≤ -0.5 | 13 | 3.3657 | 0.003 |
| Difference ≥ 0.5 | 13 | -5.4748 | 0.000 |