A food science engineer for a pet food company tests a new, less expensive formulation of their popular cat food. The engineer wants to ensure that the protein content of the less expensive formulation is the same as the protein content of the original food. The engineer measures the amount of protein in 100 gram samples of both formulations of the food to test whether they are equivalent to within ±0.5 grams.
The engineer performs a 2-sample equivalence test to determine whether the mean difference in protein between the two formulations is within ±0.5 g. The engineer does not know whether the variances of the protein content are equal for the two formulations.
- Open the sample data, CatFoodProtein.MWX.
- Choose .
- From the drop-down list, select Samples in different columns.
- In Test sample, enter Discount.
- In Reference sample, enter Original.
- From Hypothesis about, select Test mean - reference mean.
- From What do you want to determine? (Alternative hypothesis), select Lower limit < test mean - reference mean < upper limit.
- In Lower limit, enter –0.5.
- In Upper limit, enter 0.5.
- Click OK.
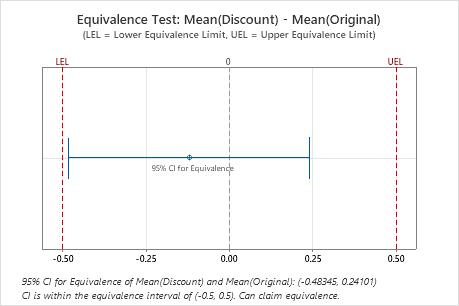
Interpret the results
Because the confidence interval is completely within the equivalence interval, the engineer concludes that the two formulations of cat food contain equivalent amounts of protein.
Method
Reference mean = mean of Original
Equal variances were not assumed for the analysis.
Descriptive Statistics
| Variable | N | Mean | StDev | SE Mean |
|---|---|---|---|---|
| Discount | 10 | 33.971 | 0.58064 | 0.18361 |
| Original | 9 | 34.092 | 0.26138 | 0.087127 |
Difference: Mean(Discount) - Mean(Original)
| Difference | SE | 95% CI for Equivalence | Equivalence Interval |
|---|---|---|---|
| -0.12122 | 0.20324 | (-0.483449, 0.241005) | (-0.5, 0.5) |
Test
| Null hypothesis: | Difference ≤ -0.5 or Difference ≥ 0.5 |
|---|---|
| Alternative hypothesis: | -0.5 < Difference < 0.5 |
| α level: | 0.05 |
| Null Hypothesis | DF | T-Value | P-Value |
|---|---|---|---|
| Difference ≤ -0.5 | 12 | 1.8637 | 0.044 |
| Difference ≥ 0.5 | 12 | -3.0566 | 0.005 |