Specify the test, specify the significance level, and select the alternative hypothesis.
Outlier test
All of Minitab's outlier tests are designed to detect a single outlier in a sample. Usually, Grubbs' test works well. However, if a sample contains more than one potential outlier, then Grubbs' test and Dixon's Q ratio may not be effective.
- If you don't know whether your data include outliers, use the Grubbs' test.
- If you know your data include one or more outliers, use one of the Dixon's tests. The Dixon's tests are designed to overcome the masking effect that multiple potential outliers can cause.
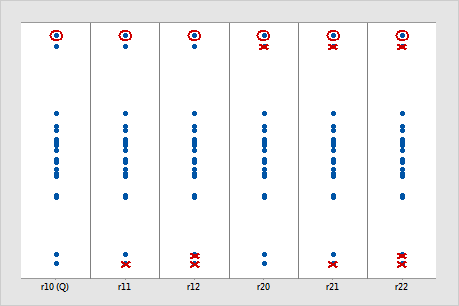
In the following illustration, each column shows how the different Dixon's ratio tests treat the same sample. The circled value is the potential outlier. The Xs indicate which data values each Dixon's ratio test ignores when it calculates the test statistic. (This illustration assumes that the alternative hypothesis is either Smallest or largest data value is an outlier or Largest data value is an outlier.) For these data, Dixon's r22 ratio test is most likely to identify the circled value as an outlier.
Larger samples from a normal population are more likely to include extreme values. Dixon proposed the following general guidelines for the ratios.
| Sample size (n) | Recommended ratio |
|---|---|
 |
r10 (also called Dixon's Q ratio) |
 |
r11 |
 |
r21 |
 |
r22 |
Significance level
Compare the significance level to the p-value to decide whether to reject or fail to reject the null hypothesis (H0). If the p-value is less than the significance level, the usual interpretation is that the results are statistically significant, and you reject H0.
- Choose a higher significance level, such as 0.10, to be more certain that you detect any difference that possibly exists. For example, a quality engineer compares the stability of new ball bearings with the stability of current bearings. The engineer must be highly certain that the new ball bearings are stable because unstable ball bearings could cause a disaster. The engineer chooses a significance level of 0.10 to be more certain of detecting any possible difference in stability of the ball bearings.
- Choose a lower significance level, such as 0.01, to be more certain that you detect only a difference that actually exists. For example, a scientist at a pharmaceutical company must be very certain about a claim that the company's new drug significantly reduces symptoms. The scientist chooses a significance level of 0.001 to be more certain that any significant difference in symptoms does exist.
What do you want to determine? (Alternative hypothesis)
- Smallest or largest data value is an outlier: Use this two-sided test when either the smallest data value or the largest data value might be an outlier. This two-sided test can detect outliers for either the smallest or largest data value, but it has less power than a one-sided test.
- Smallest data value is an outlier: Use this one-sided test when you suspect that the smallest data value is an outlier. This one-sided test has greater power than a two-sided test, but it cannot detect outliers that are the largest data value.
- Largest data value is an outlier: Use this one-sided test when you suspect that the largest data value is an outlier. This one-sided test has greater power than a two-sided test, but it cannot detect outliers that are the smallest data value.