What is a contour plot?
Use a contour plot to explore the potential relationship between three variables. Contour plots display the 3-dimensional relationship in two dimensions, with x- and y-factors (predictors) plotted on the x- and y-scales and response values represented by contours. A contour plot is like a topographical map in which x-, y-, and z-values are plotted instead of longitude, latitude, and elevation.
For example, the following plot shows how reheat time (y) and temperature (x) affect the quality (contours) of a frozen entree.
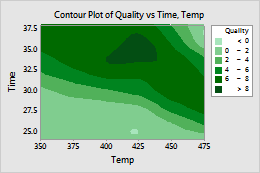
The darker regions identify higher z-values. The contour levels reveal a peak centered in the vicinity of 35 minutes (Time) and 425o (Temp). Quality scores in this peak region are greater than 8.
How contours are represented on a plot
Contours can be represented by shaded areas, contour lines, or both.

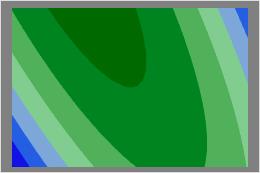
Area only
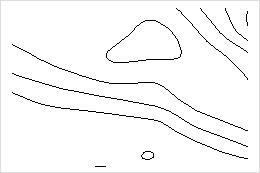
Contour lines only
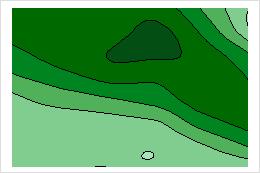
Contour lines and area
You can change the number and colors of contour levels.
What are 3D surface and 3D wireframe plots?
3D surface and 3D wireframe plots are graphs that you can use to explore the potential relationship between three variables. The predictor variables are displayed on the x- and y-scales, and the response (z) variable is represented by a smooth surface (3D surface plot) or a grid (3D wireframe plot).
Examples
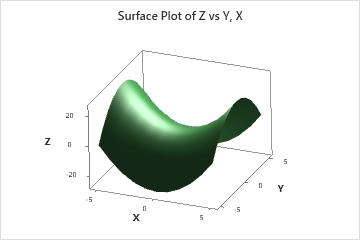
3D surface plot
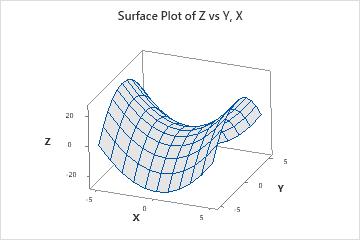
3D wireframe plot
A comparison of contour plots and 3D surface plots
- A contour plot provides a 2-dimensional view of the surface where points that have the same response are connected to produce contour lines of constant responses. Contour plots are useful for establishing the response values and operating conditions that you want.
- A 3D surface plot displays a 3-dimensional view of the surface. Like contour plots, 3D surface plots are useful for establishing response values and operating conditions that you want. 3D surface plots can provide a clearer concept of the response surface than contour plots.
The following figures compare these two types of plots.
Typical patterns that occur in contour plots and 3D surface plots
Simple maximum pattern
The following 3D surface and contour plots represent a response surface with a simple maximum. As the color gets darker, the response increases. Note the relationship between the shape of the surface and the shape of the contours. Both the surface and contour plots are based on a regression model.
Simple maximum 3D surface plot
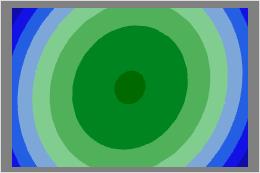
Simple maximum contour plot
Minimax pattern
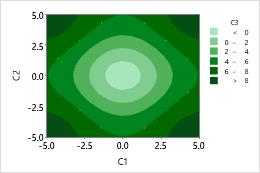
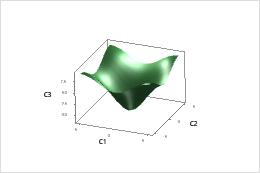
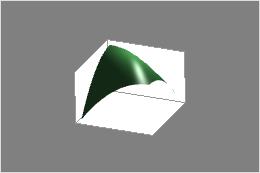
The following 3D surface and contour plots represent a minimax response surface. As the color gets darker, the response increases. Note the relationship between the shape of the surface and the shape of the contours. From the stationary point (saddle point) near the center of the design, increasing or decreasing both factors at the same time leads to a decrease in the response. But from the stationary point (saddle point), increasing either factor while decreasing the other leads to an increase in the response. Both the surface and contour plots are based on a regression model.
Minimax 3D surface plot
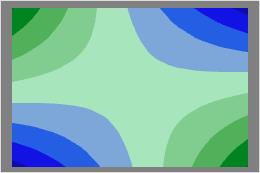
Minimax contour plot
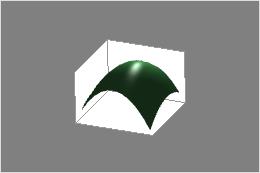
Stationary ridge pattern
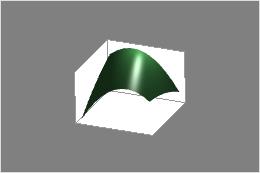
The following 3D surface and contour plots represent a stationary ridge surface. As the color gets darker, the response increases. A stationary ridge is shaped like an arch. In these graphs, there are many possible factor settings that maximize the response. Note the relationship between the shape of the surface and the shape of the contours. Both the surface and contour plots are based on a regression model.
Stationary ridge 3D surface plot

Stationary ridge contour plot
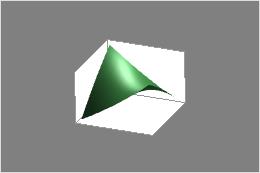
Rising ridge pattern
The following 3D surface and contour plots represent a rising ridge surface. As the color gets darker, the response increases. The response increases as you decrease time and increase temperature at the same time. Note the relationship between the shape of the surface and the shape of the contours. Both the surface and contour plots are based on a regression model.
Rising ridge 3D surface plot