Technicians measure insolation as part of a solar thermal energy test. An energy engineer wants to determine how insolation is predicted by the position of the east, south, and north focal points.
The engineer fits the regression model and then uses Factorial Plots to better understand the effects.
- Open the sample data, ThermalEnergyTest.MWX.
- Choose .
- From Response, select Insolation.
- Under Variables to Include in Plots, move East, South, and North from the Available list to the Selected list.
- Click OK.
Interpret the results
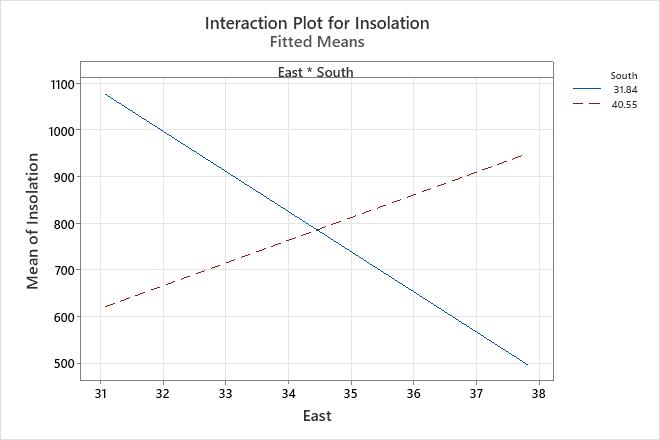
The interaction plot shows the fitted means of insolation by combinations of focal point settings for East and South. This plot shows an apparent interaction effect because the lines are not parallel, which implies that the relationship between insolation and East depends upon the setting for South. The results of the regression analysis indicate that the interaction effect for East*South is statistically significant.
Insolation increases with higher values of East when South is high. However, insolation decreases with higher values of East when South is low.
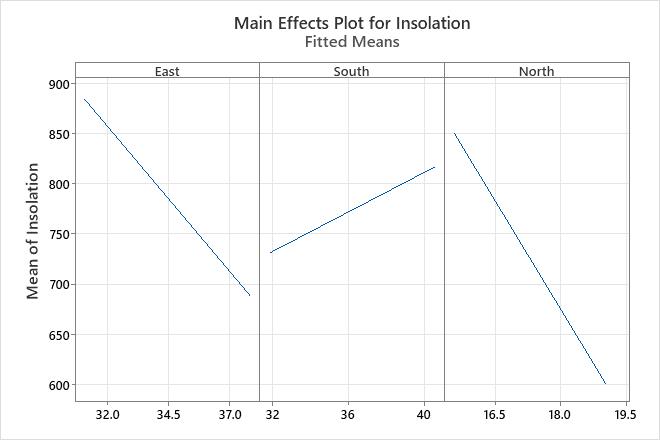
The main effects plots show the fitted means for each continuous variable while the other variables in the model are held constant. Because the lines are not horizontal, main effects are present for all of these variables. The results of the regression analysis confirm that all main effects are all statistically significant. However, because the interaction effects are statistically significant, the main effects plot can be misleading. Consequently, you cannot interpret the main effects without considering the interaction effects.