A marketing analyst wants to assess trends in tennis racquet sales. The analyst collects sales data from the previous five years to predict the sales of the product for the next 3 months.
- Open the sample data, TennisRacquetSales.MWX.
- Choose .
- In Variable, enter Racquets.
- Under Model Type, select Quadratic.
- Select Generate forecasts. In Number of forecasts, enter 3.
- Click OK.
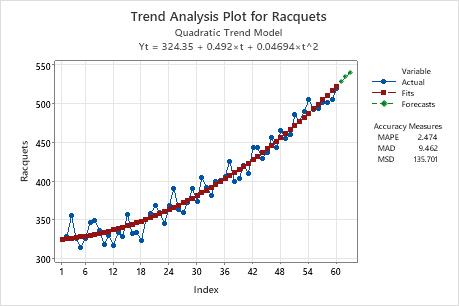
Interpret the results
The trend analysis plot shows a general upward trend. There is curvature and the model appears to fit the data well, which indicates a good fit. The analyst can be confident in the forecasts for the next 3 months.
Method
| Model type | Quadratic Trend Model |
|---|---|
| Data | Racquets |
| Length | 60 |
| NMissing | 0 |
Fitted Trend Equation
| Yt = 324.35 + 0.492×t + 0.04694×t^2 |
|---|
Accuracy Measures
| MAPE | 2.474 |
|---|---|
| MAD | 9.462 |
| MSD | 135.701 |
Forecasts
| Period | Forecast |
|---|---|
| 61 | 528.984 |
| 62 | 535.249 |
| 63 | 541.608 |