Uses of the lognormal distribution to model reliability data
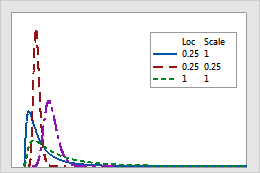
The lognormal distribution is a flexible distribution that is closely related to the normal distribution. This distribution can be especially useful for modeling data that are roughly symmetric or skewed to the right. Like the Weibull distribution, the lognormal distribution can have markedly different appearances depending on its scale parameter.
In fact, the lognormal model and the Weibull model may sometimes fit a specific set of life test data equally well. However, there is one important difference to consider. When using these distributions to extrapolate beyond the range of sample data, the lognormal will predict lower average failure rates at earlier times than the Weibull distribution.
- Failure due to chemical reactions or degradation, such as corrosion, migration, or diffusion, which is common with semiconductor failure
- Time to fracture in metals subject to the growth of fatigue cracks
- Electronic components that exhibit decreased risk of failure after a certain time
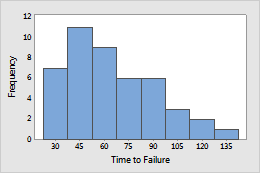
Example 1: Electronic components
Engineers record the time to failure of an electronic component under normal operating conditions. The component shows a decreased risk of failure over time which could be modeled using a lognormal distribution.
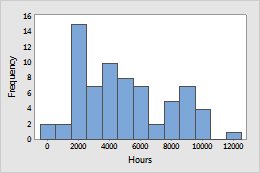
Example 2: Diesel generator fans
Time until failure was tracked during the life of diesel generator fans. A lognormal distribution was used to model the data.
Probability density function and hazard function for the lognormal distribution
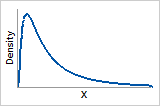
Probability density function
The data are skewed to the right.
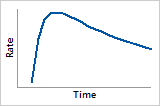
Hazard function
The risk of failure quickly increases to a maximum, then decreases.