The probability plot for the Cox-Snell residuals will help you check the following:
- Whether the distribution at each level of the accelerating variable is appropriate
- Whether the transformation of the accelerating variable is appropriate
- Whether the assumption of equal shape (Weibull or exponential) or scale parameter (other distributions) at each level of the accelerating variable is appropriate
The probability plot for Cox-Snell residuals combines the data so that only one fitted line is calculated. With only one fitted line, you can more easily determine whether the plotted points follow the fitted line closely. In contrast, the probability plot that is based on the fitted model may have multiple fitted lines, with one line for each accelerating level. As a result, each line may have only a limited number of plotted points, and the plot may suggest violations of the assumptions due to only one or two inconsistent observations.
- If the plotted points follow the fitted line closely, then the assumptions are appropriate for the accelerating levels.
- If the plotted points do not follow the fitted line closely, then any or all of the assumptions may be violated.
Example output
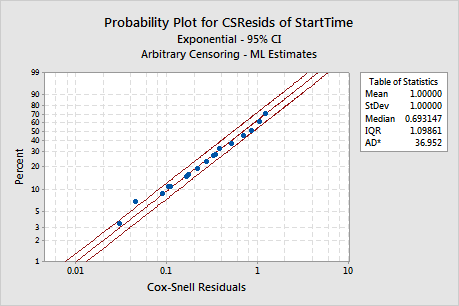
Interpretation
For the electronic device data, the plotted points follow the fitted line closely and thus provide more evidence that the model is appropriate for the accelerating levels.