Use the probability plot at each level of the accelerating variable based on fitted model to check the following:
- Whether the distribution at each level of the accelerating variable is appropriate
- Whether the transformation at each level of the accelerating variable is appropriate
- Whether the assumption of equal shape (Weibull or exponential) or scale parameter (other distributions) at each level of the accelerating variable is appropriate
The fitted lines are based on the fitted model (here, Weibull distribution and Arrhenius transformation) and will always be parallel because the shape (or scale) parameter is assumed to be equal.
- If the plotted points follow each fitted line closely, then the fitted model is appropriate for the data.
- If the plotted points do not follow each fitted line closely, then any or all of the assumptions may be violated.
Example Output
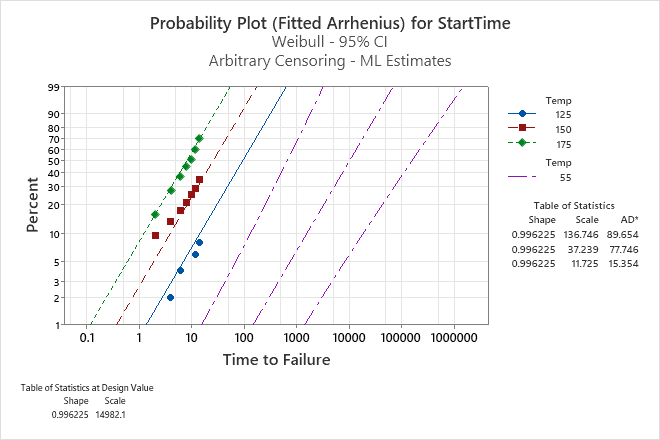
Interpretation
For the electronic device data, the lines fit the points adequately; therefore, the model for the accelerating values is appropriate. Only engineering/process knowledge can verify that the same relationship holds at normal use conditions.
The fitted line and the confidence level at the design temperature (55°C) are also included on the plot.