A wine producer wants to know how the chemical composition of his wine relates to sensory evaluations. He has 37 Pinot Noir samples, each described by 17 elemental concentrations (Cd, Mo, Mn, Ni, Cu, Al, Ba, Cr, Sr, Pb, B, Mg, Si, Na, Ca, P, K) and a score on the wine's aroma from a panel of judges. He wants to predict the aroma score from the 17 elements. Data are from: I.E. Frank and B.R. Kowalski (1984). "Prediction of Wine Quality and Geographic Origin from Chemical Measurements by Partial Least-Squares Regression Modeling," Analytica Chimica Acta, 162, 241 − 251.
The producer wants to include all the concentrations and all the 2-way interactions that include cadmium (Cd) in the model. Because the ratio of samples to predictors is low, the producer decides to use partial least squares regression.
- Open the sample data WineAroma.MWX.
- Choose .
- In Responses, enter Aroma.
- In Model, enter Cd-K Cd*Mo Cd*Mn Cd*Ni Cd*Cu Cd*Al Cd*Ba Cd*Cr Cd*Sr Cd*Pb Cd*B Cd*Mg Cd*Si Cd*Na Cd*Ca Cd*P Cd*K.
- Click Options.
- Under Cross-Validation, select Leave-one-out. Click OK.
- Click Graphs. Select Model selection plot. Deselect Response plot and Coefficient plot.
- Click OK in each dialog box.
Interpret the results
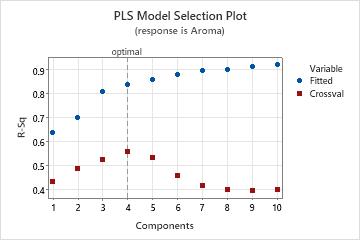
The model selection plot identifies the model with 4 components as the optimal model because the 4-component model has the highest predicted R2 value. The predicted R2 values on the plot are calculated with cross-validation. The model selection and validation table shows that the predicted R2 value for the optimal model is approximately 0.56. Minitab uses the optimal model for the analysis of variance calculations. The optimal model is statistically significant at the 0.05 level of significance because the p-value is approximately 0.000.
Analysis of Variance for Aroma
| Source | DF | SS | MS | F | P |
|---|---|---|---|---|---|
| Regression | 4 | 34.5514 | 8.63784 | 41.55 | 0.000 |
| Residual Error | 32 | 6.6519 | 0.20787 | ||
| Total | 36 | 41.2032 |
Model Selection and Validation for Aroma
| Components | X Variance | Error | R-Sq | PRESS | R-Sq (pred) |
|---|---|---|---|---|---|
| 1 | 0.158849 | 14.9389 | 0.637435 | 23.3439 | 0.433444 |
| 2 | 0.442267 | 12.2966 | 0.701564 | 21.0936 | 0.488060 |
| 3 | 0.522977 | 7.9761 | 0.806420 | 19.6136 | 0.523978 |
| 4 | 0.594546 | 6.6519 | 0.838559 | 18.1683 | 0.559056 |
| 5 | 5.8530 | 0.857948 | 19.2675 | 0.532379 | |
| 6 | 5.0123 | 0.878352 | 22.3739 | 0.456988 | |
| 7 | 4.3109 | 0.895374 | 24.0041 | 0.417421 | |
| 8 | 4.0866 | 0.900818 | 24.7736 | 0.398747 | |
| 9 | 3.5886 | 0.912904 | 24.9090 | 0.395460 | |
| 10 | 3.2750 | 0.920516 | 24.8293 | 0.397395 |