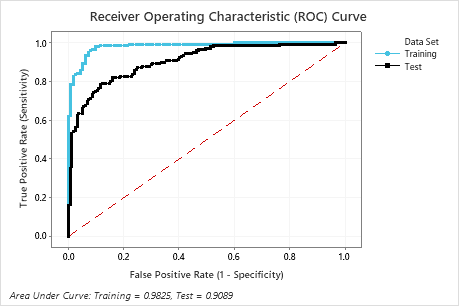
The ROC curve plots the true positive rate (TPR), also known as power, on
the y-axis. The ROC curve plots the false positive rate (FPR), also known as
type 1 error, on the x-axis. The area under an ROC curve indicates whether the
model is a good classifier.
Interpretation
For classification trees, the area under the ROC curve values typically range from 0.5 to 1.
Larger values indicate a better classification model. When the model can perfectly separate
the classes, then the area under the curve is 1. When the model cannot separate the classes
better than a random assignment, then the area under the curve is 0.5. The red dotted line
indicates the random assignment case.
The area under the test curve is approximately 0.91. Compare the training results
and the test results to see whether there are overfitting problems with the model for
the training data set.