A cause-and-effect diagram (C&E diagram) is a brainstorming tool that helps you investigate various causes that affect a specific effect. Use a C&E diagram with your team to prioritize problem areas and develop improvement ideas.
Causes in a C&E diagram are frequently arranged into six major categories for manufacturing applications: Personnel, Machines, Materials, Methods, Measurements, and Environment. Service quality applications often include Personnel, Procedures, and Policies. However, C&E diagrams can include any type of cause that you want to investigate.
The C&E diagram is sometimes called a fishbone diagram, because it resembles the skeleton of a fish, or an Ishikawa diagram after its creator, Kaoru Ishikawa.
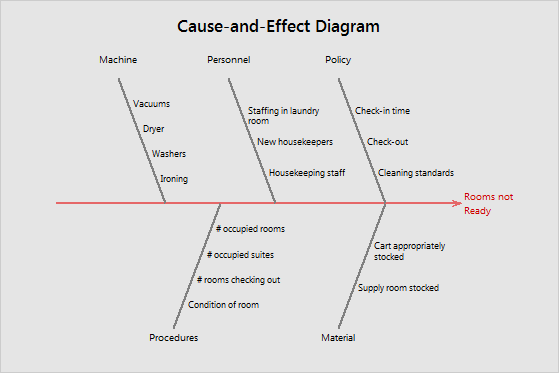
Example of a cause-and-effect diagram
A hotel manager wants to investigate why rooms are not ready for check-in at 4:00 PM. The manager brainstorms reasons with the improvement team and creates a cause-and-effect diagram to categorize the reasons. The team can then prioritize problem areas and develop improvement ideas.