In This Topic
Step 1: Assess the normality of the data
Minitab provides tolerance intervals for the normal method and the nonparametric method. If you can safely assume that your data follow a normal distribution, then you can use the normal method tolerance interval. If you cannot safely assume that your data follow a normal distribution, then you must use the nonparametric method tolerance interval.
To determine whether you can assume that the data follow a normal distribution, compare the p-value from the normality test to the significance level (α). A significance level of 0.05 indicates a 5% risk of concluding that the data do not follow a normal distribution when the data do follow a normal distribution.
- P-value ≤ α: The data do not follow a normal distribution (Reject H0)
- If the p-value is less than or equal to the significance level, you can conclude that your data do not follow a normal distribution. In this case, you must use the nonparametric method tolerance interval.
- P-value > α: You do not have enough evidence to conclude that the data do not follow a normal distribution (Fail to reject H0)
- If the p-value is larger than the significance level, you do not have enough evidence to conclude that the data do not follow a normal distribution. In this case, you can use the normal method tolerance interval.

Key Results: P-Value
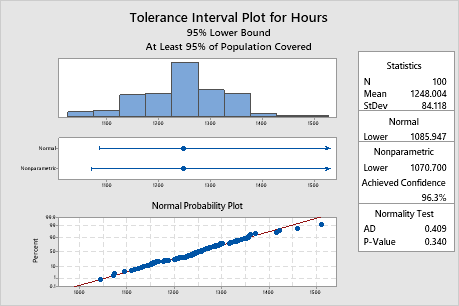
In these results, the p-value is 0.340, which is greater than the significance level of 0.05. Because you can assume that your data follow a normal distribution, you can use the normal method tolerance interval.
Step 2: Examine the tolerance interval from the appropriate method
- Two-sided
- Use a two-sided interval to determine the interval that contains a certain percentage of the population measurements.
- Upper bound
- Use an upper bound to determine the interval that indicates that a certain percentage of population measurements will not be greater than an upper limit.
- Lower bound
- Use a lower bound to determine the interval that indicates that a certain percentage of population measurements will not be less than a lower limit.
