In This Topic
Parametric distribution method
Tolerance intervals are a range of values for a specific quality characteristic of a product that likely covers a specified minimum percentage of current or future product output. Use the method for a parametric distribution if you can safely assume that your sample comes from a population that follows that distribution.
If your data follow a parametric distribution, then a method that uses that distribution is more precise and economical than the nonparametric method. A method that uses a distribution achieves smaller margins of error with fewer observations, as long as the chosen distribution is appropriate for your data.
Methods that use a parametric distribution are not robust to severe departures from that distribution. If you are unsure of the population distribution, use Overview for Individual Distribution Identification. If you know that the population distribution is not on the list of distributions for nonnormal tolerance intervals, then use the nonparametric method.
Interpretation
- Two-sided
- Use a two-sided interval to determine an interval that contains a certain minimum percentage of the population measurements.
- Upper bound
- Use an upper bound to determine a limit that exceeds a certain minimum percentage of population measurements.
- Lower bound
- Use a lower bound to determine a limit that is less than a certain minimum percentage of population measurements.
Nonparametric method
Tolerance intervals are a range of values for a specific quality characteristic of a product that likely covers a specified minimum percentage of current or future product output. If you cannot safely assume that your sample comes from a parametric distribution that is in Minitab, you muse use the nonparametric method tolerance interval.
The nonparametric method requires only that the data are continuous. However, the nonparametric method requires large sample sizes for the results to be accurate. If your sample size is not large enough, the nonparametric interval is a non-informative interval that ranges from negative infinity to infinity. In this case, Minitab displays a finite interval based on the range of your data. As a result, the achieved confidence level is much lower than the target confidence level.
Interpretation
- Two-sided
- Use a two-sided interval to determine an interval that contains a certain minimum percentage of the population measurements.
- Upper bound
- Use an upper bound to determine a limit that exceeds a certain minimum percentage of population measurements.
- Lower bound
- Use a lower bound to determine a limit that is less than a certain minimum percentage of population measurements.
Achieved confidence
For the nonparametric method, Minitab calculates the achieved confidence level. This is the exact confidence level obtained from your sample. It will generally be greater than or equal to the target confidence level, unless your sample size is too small.
If your sample size is not large enough, the nonparametric interval is a non-informative interval that ranges from negative infinity to infinity. In this case, Minitab displays a finite interval based on the range of your data. As a result, the achieved confidence level is much lower than the target confidence level.
Interpretation
- Two-sided
- Use a two-sided interval to determine an interval that contains a certain minimum percentage of the population measurements.
- Upper bound
- Use an upper bound to determine a limit that exceeds a certain minimum percentage of population measurements.
- Lower bound
- Use a lower bound to determine a limit that is less than a certain minimum percentage of population measurements.
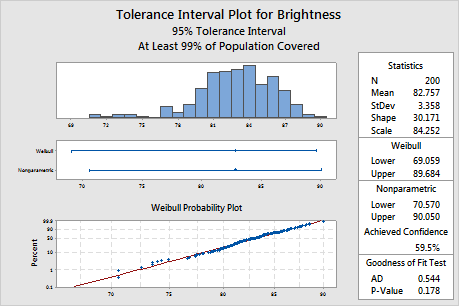
Tolerance interval plot
- Histogram: Shows the distribution of your sample data. Each bar on the histogram represents the frequency of data within an interval.
- Interval plots: Show the mean and the upper and/or lower bounds of the tolerance interval for each method. A vertical line at the end of the interval represents a bound, and an arrow indicates that no bound for that side of the interval exists.
- Probability plot: Shows how well your data fit the distribution. If your data are follow the distribution, then the data points on the probability plot fall along the assumed distribution fitted line.
- Statistics table: Displays the sample size, mean, and standard deviation.
- Parametric distribution table: Displays the upper and/or lower bounds of the method that uses a parametric distribution.
- Nonparametric table: Displays the upper and/or lower bounds of the nonparametric method tolerance interval, and the achieved confidence level.
- Goodness of Fit Test table: Shows the p-value and the Anderson-Darling test value. To determine whether you can assume that the data follow the distribution, compare the p-value from the test to the significance level (α). If the p-value is less than or equal to the significance level, you can conclude that your data do not follow the distribution. In this case, try an alternative distribution or use the nonparametric method tolerance interval if the achieved confidence level is close to the target level..
Interpretation
The probability plot shows that the plotted points fall along the Weibull distribution fitted line, which indicates that the data follow a Weibull distribution. Also, the p-value of the goodness-of-fit test is 0.178, which is greater than the significance level of 0.05. Because you cannot conclude that the data do not follow the Weibull distribution, you can use the interval for the Weibull distribution.
The Weibull interval ranges from approximately 69.1 to 89.7, so the manufacturer can be 95% confident that at least 99% of all batches of pulp will fall in this interval. For all the batches of pulp, the mean brightness level is approximately 82.8.