In This Topic
Probability plot
The probability plots include:
- Points, which are the estimated percentiles for corresponding probabilities of an ordered data set.
- Middle lines, which are the expected percentile from the distribution based on maximum likelihood parameter estimates. If the distribution is a good fit for the data, the points fall along the middle line.
Estimated probabilities
Minitab estimates the probability (P) that is used to calculate the plot points using the following methods.
- Median rank (Benard's method)

- Mean Rank (Herd-Johnson estimate)

- Modified Kaplan-Meier (Hazen)

- Kaplan-Meier product limit estimate

Notation
| Term | Description |
|---|---|
| n | Number of observations |
| i | Rank of the ith ordered observation x(i), where x(1), x(2),...x(n) are the order statistics, or the data ordered from smallest to largest |
Plot points
The middle line of the probability plot is constructed using the x and y coordinate calculations in this table.
| Distribution | x coordinate | y coordinate |
|---|---|---|
| Smallest extreme value | x | ln(–ln(1 – p)) |
| Largest extreme value | x | ln(–ln p) |
| Weibull | ln(x) | ln(–ln(1 – p)) |
| 3-parameter Weibull | ln(x – threshold) | ln(–ln(1 – p)) |
| Exponential | ln(x) | ln(–ln(1 – p)) |
| 2-parameter exponential | ln(x – threshold) | ln(–ln(1 – p)) |
| Normal | x | Φ–1norm |
| Lognormal | ln(x) | Φ–1norm |
| 3-parameter lognormal | ln(x – threshold) | Φ–1norm |
| Logistic | x |
 |
| Loglogistic | ln(x) |
 |
| 3-parameter loglogistic | ln(x – threshold) |
 |
| Gamma | x | Φ–1gamma |
| 3-parameter gamma | ln(x – threshold) | Φ–1gamma |
Note
Because the plot points do not depend on any distribution, they are the same (before being transformed) for any probability plot. However, the fitted line differs depending on the parametric distribution chosen.
Notation
| Term | Description |
|---|---|
| p | The estimated probability |
| Φ-1norm | Value returned for p by the inverse CDF for the standard normal distribution |
| Φ-1gamma | Value returned for p by the inverse CDF for the incomplete gamma distribution |
| ln(x) | The natural log of x |
Percentiles and std error of percentiles
Percentile is a value on a scale of 100 that indicates the percent of a distribution that is equal to or below that value. By default, Minitab displays tables of percentiles for parametric distribution analysis for common percentiles.
The standard errors for the percentile estimates are the square root of the variances.
 ,
,  ,
,  ,
,  ,
,  ,
,  ,
,  ,
,  , and
, and  denote the variances and covariances of the MLEs of μ, σ, α, β, λ, and θ taken from the appropriate element of the inverse of the Fisher information matrix.
The formulas used for percentile and variance estimates are as follows:
Smallest extreme value distribution
- Percentile
-

- Variance
-

Largest extreme value distribution
- Percentile
-

- Variance
-

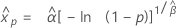
Weibull distribution
- Percentile
-
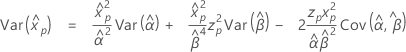
- Variance
-
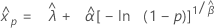
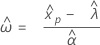
3-parameter Weibull distribution
- Percentile
-
- Variance
-

Exponential distribution
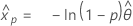
- Percentile
-
- Variance
-

2-parameter exponential distribution
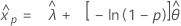
- Percentile
-
- Variance
-

Normal distribution
- Percentile
-

- Variance
-

Lognormal distribution
- Percentile
-

- Variance
-

3-parameter lognormal distribution
- Percentile
-

- Variance
-

Logistic distribution
- Percentile
-

- Variance
-

Loglogistic distribution
- Percentile
-

- Variance
-

3-parameter loglogistic distribution
- Percentile
-

- Variance
-

Gamma distribution
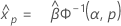
- Percentile
-
- Variance
-

-
where
 is the inverse of the regularized incomplete gamma distribution
3-parameter gamma distribution
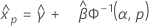
- Percentile
-
- Variance
-

-
where
 is the inverse of the regularized incomplete gamma distribution
Confidence limits for percentiles
| Distribution | Confidence limits |
|---|---|
| Smallest extreme value |
 |
| Largest extreme value |
 |
| Normal |
 |
| Logistic |
 |
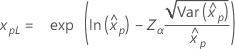
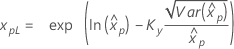
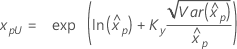
| Weibull |
 |
| Exponential |
 |
| Lognormal |
 |
| Loglogistic |
 |
| 3-parameter Weibull |
If λ < 0:
 If λ ≥ 0:
  |
| 2-parameter exponential |
If λ < 0:
 If λ ≥ 0:
  |
| 3-parameter lognormal |
If λ < 0:
 If λ ≥ 0:
  |
| 3-parameter loglogistic |
If λ < 0:
 If λ ≥ 0:
  |
Notation
| Term | Description |
|---|---|
| Kγ | The (1 + γ) / 2 percentile of a standard normal distribution |