In This Topic
Step 1: Use the ANOVA table to identify significant factors and interactions
- Part: The variation that is from the parts.
- Operator: The variation that is from the operators.
- Operator*Part: The variation that is from the operator and part interaction. An interaction exists when an operator measures different parts differently.
- Error or repeatability: The variation that is not explained by part, operator, or the operator and part interaction.
Note
If you select the Xbar and R option for Method of Analysis, Minitab does not display the ANOVA table.
If the p-value for the operator and part interaction is 0.05 or higher, Minitab removes the interaction because it is not significant and generates a second ANOVA table without the interaction.
Two-Way ANOVA Table With Interaction
| Source | DF | SS | MS | F | P |
|---|---|---|---|---|---|
| Part | 9 | 88.3619 | 9.81799 | 492.291 | 0.000 |
| Operator | 2 | 3.1673 | 1.58363 | 79.406 | 0.000 |
| Part * Operator | 18 | 0.3590 | 0.01994 | 0.434 | 0.974 |
| Repeatability | 60 | 2.7589 | 0.04598 | ||
| Total | 89 | 94.6471 |
Two-Way ANOVA Table Without Interaction
| Source | DF | SS | MS | F | P |
|---|---|---|---|---|---|
| Part | 9 | 88.3619 | 9.81799 | 245.614 | 0.000 |
| Operator | 2 | 3.1673 | 1.58363 | 39.617 | 0.000 |
| Repeatability | 78 | 3.1179 | 0.03997 | ||
| Total | 89 | 94.6471 |
Key Result: P
In these results, the p-value is 0.974, so Minitab generates a second two-way ANOVA table that omits the interaction from the final model.
Step 2: Assess the variation for each source of measurement error
- Total Gage R&R: The sum of the repeatability and the reproducibility variance components.
- Repeatability: The variability in measurements when the same operator measures the same part multiple times.
- Reproducibility: The variability in measurements when different operators measure the same part.
- Part-to-Part: The variability in measurements due to different parts.
Ideally, very little of the variability should be due to repeatability and reproducibility. Differences between parts (Part-to-Part) should account for most of the variability.
Variance Components
| Source | VarComp | %Contribution (of VarComp) |
|---|---|---|
| Total Gage R&R | 0.0020816 | 6.82 |
| Repeatability | 0.0011541 | 3.78 |
| Reproducibility | 0.0009275 | 3.04 |
| Part-To-Part | 0.0284585 | 93.18 |
| Total Variation | 0.0305401 | 100.00 |
Key Results: VarComp, %Contribution
The %Contribution for part-to-part variation is 93.18%. Minitab divides the part-to-part variance component value, approximately 0.0285, by the total variation, approximately 0.0305, and multiplies by 100%. When the %Contribution from part-to-part variation is high, the measurement system can reliably distinguish between parts.
Gage Evaluation
| Source | StdDev (SD) | Study Var (6 × SD) | %Study Var (%SV) | %Tolerance (SV/Toler) |
|---|---|---|---|---|
| Total Gage R&R | 0.045625 | 0.27375 | 26.11 | 27.37 |
| Repeatability | 0.033972 | 0.20383 | 19.44 | 20.38 |
| Reproducibility | 0.030455 | 0.18273 | 17.43 | 18.27 |
| Part-To-Part | 0.168696 | 1.01218 | 96.53 | 101.22 |
| Total Variation | 0.174757 | 1.04854 | 100.00 | 104.85 |
Key Results: %Study Var
Use the percent study variation (%Study Var) to compare the measurement system variation to the total variation. The %Study Var uses the process variation, as defined by 6 times the process standard deviation. Minitab displays the %Tolerance column when you enter a tolerance value, and Minitab displays the %Process column when you enter a historical standard deviation.
According to AIAG guidelines, if the measurement system variation is less than 10% of the process variation, then the measurement system is acceptable. Because the %Study Var, the %Tolerance, and the %Process are all greater than 10%, the measurement system might need improvement. For more information, go to Is my measurement system acceptable?.
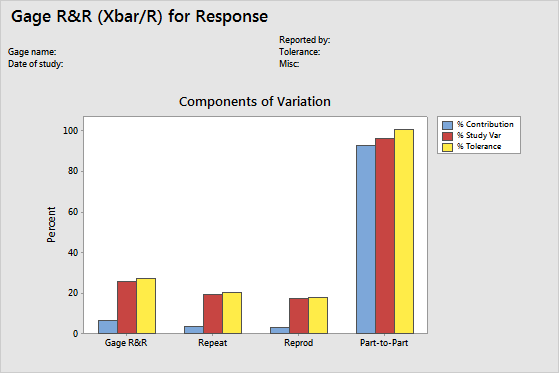
Key Results: Components of Variation graph
The components of variation graph shows the variation from the sources of measurement error. Minitab displays bars for %Tolerance when you enter a tolerance value, and Minitab displays bars for %Process when you enter a historical standard deviation.
This graph shows that part-to-part variability is higher than the variability from repeatability and reproducibility, but the total gage R&R variation is higher than 10% and might be unacceptable.
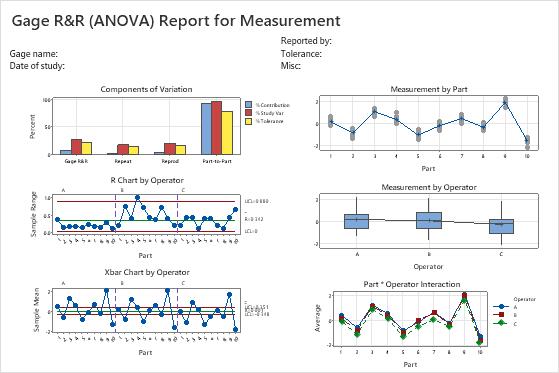
Step 3: Examine the graphs for more information on the gage study
- Components of variation graph
- Shows whether the largest of component of variation is part-to-part variation.
- R chart by operator
- Shows whether any points fall above the upper control limit.
- Xbar chart by operator
- Shows whether most points fall beyond the control limits.
- Measurements by part graph
- Shows whether multiple measurements for each part are close together.
- Measurements by operator graph
- Shows whether differences between operators are small compared to the differences between parts.
- The operator*part interaction graph
- Shows whether the lines that connect the measurements from each operator are similar or whether the lines cross each other.