What is a variables control chart?
Variables control charts plot continuous measurement process data, such as length or pressure, in a time-ordered sequence. In contrast, attribute control charts plot count data, such as the number of defects or defective units. Variables control charts, like all control charts, help you identify causes of variation to investigate, so that you can adjust your process without over-controlling it.
There are two main types of variables control charts: charts for data collected in subgroups and charts for individual measurements.
Variables control charts for subgroup data
Each point on the graph represents a subgroup; that is, a group of units produced under the same set of conditions. For example, you want to chart a particular measurement from your process. If you collect and measure five parts every hour, your subgroup size would be 5.
Variables control charts for subgroups include Xbar, R, S, and Zone.
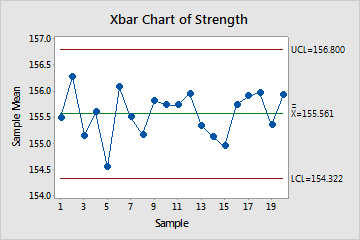
Xbar chart
Plots the process mean over time. Use to track the process level and detect the presence of special causes affecting the mean.
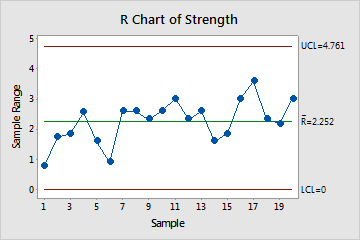
R chart
Plots the process range over time. Use to track process variation and detect unexpected variation.
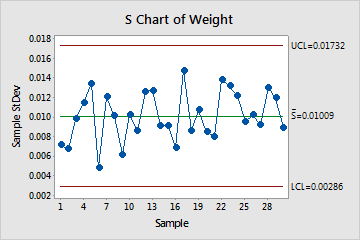
S chart
Plots the process standard deviation over time. Use to track the process variation and detect unexpected variation.
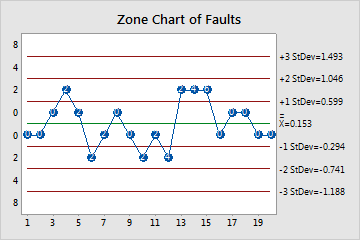
Zone chart
Plots the cumulative scores based on "zones" at 1, 2, and 3 standard deviations from the center line. Use to detect unexpected variation.
Note
Minitab also offers several combination charts for subgroups: Xbar-R, Xbar-S, I-MR-R/S (between/within). Use these to view both the process mean and the process variation at the same time.
Variables control charts for individuals data
Each point on the graph represents an individual measurement; thus, the subgroup size is 1. Individuals charts are used when measurements are expensive, production volume is low, or products have a long cycle time; for example, to test the impact strength of parts (destructive testing). Individuals control charts include I charts and MR charts.
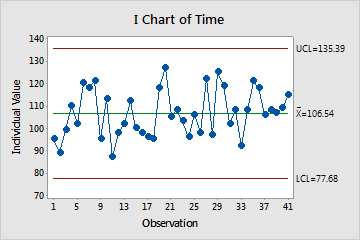
I chart
Plots individual observations over time. Use to track the process level and detect the presence of special causes.
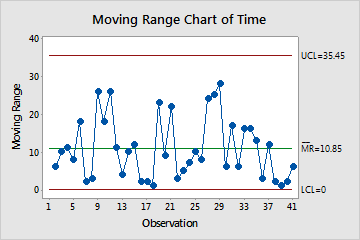
Moving range chart
Plots the moving range over time. Use to track the process variation and detect the presence of special causes.
Note
Minitab also offers I-MR and Z-MR combination charts for individuals. Use these to view both the process mean and the process variation at the same time.
Other types of variables control charts
- Time-weighted control charts – Use historical data points to help you track small shifts in a process.
- Multivariate control charts – Show how correlated variables jointly affect a process or outcome.
