menu
Minitab
®
Support
Axes and ticks for
G Chart
Learn more about Minitab
Stat
>
Control Charts
>
Rare Event Charts
>
G
>
Scale
>
Axes and Ticks
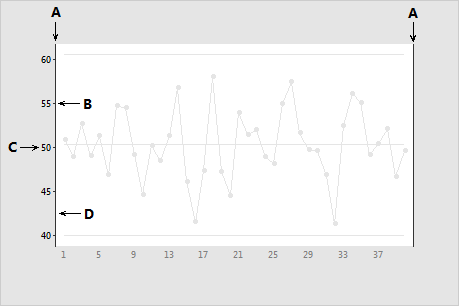
Specify which scale elements to display and where to display them. The following example illustrates the components of the y-axis for a typical control chart.
A: Y-scale axis lines
B: Y-scale major tick
C: Y-scale major tick label
D: Y-scale minor tick
Notice
You are now leaving support.minitab.com.
Click Continue to proceed to: